
This device is intended to provide the user with a cost-efficient means of determining air quality. Our sensor focuses on the five components of the Environmental Protection Agency's Air Quality Index: ozone, particulate matter, carbon monoxide, sulfur dioxide, and nitrous oxide. This device detects all of these pollutants except sulfur dioxide. The device also includes a town gas sensor to alert the user to gas leaks or the presence of flammable gases. Furthermore, a temperature and humidity sensor is included as these conditions can impact the performance of the gas sensors.
We have yet to fully calibrate our device, but we have extracted data from sensor data sheets to make some preliminary estimations. The sensors used are relatively inexpensive and vary greatly from component to component so they need to be calibrated with known concentrations of the target gasses. We have not yet had the opportunity do so.
Step 1: Materials
Control and Power
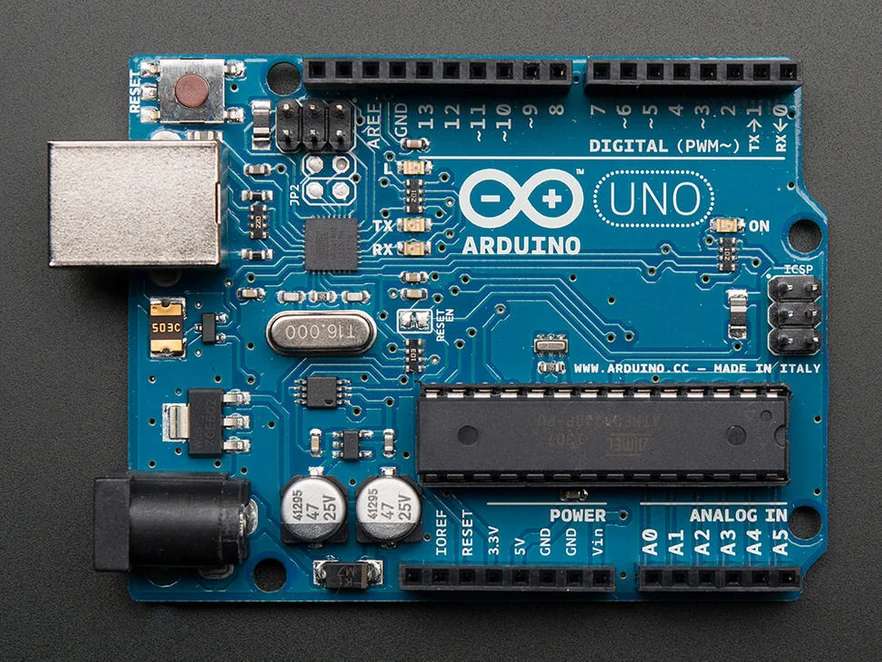
- Arduino Uno
- 5V power supply
- RGB 16×2 LCD shield
Sensors
- Shinyei PPD42 Particulate Matter Detector
- MQ-2 Gas Sensor
- MQ-9 Gas Sensor
- MiCS-2714 Gas Sensor (NO2)
- MiSC-2614 Gas Sensor (Ozone)
- Keyes DHT11 Temperature and Humidity Sensor
Box and Assembly
- Access to 3D printer
- Solder Board
- 5V fan
- 10 to 15 wires of gauge 24
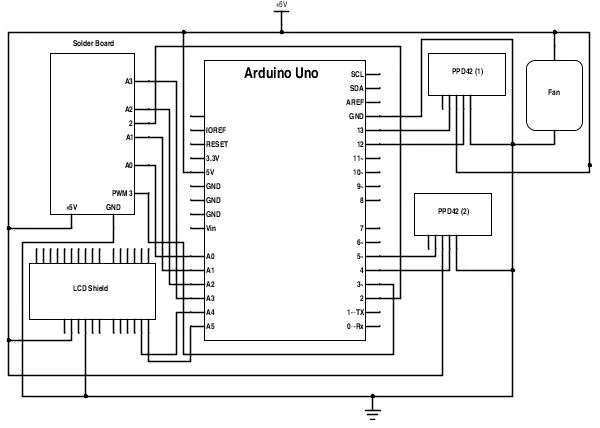
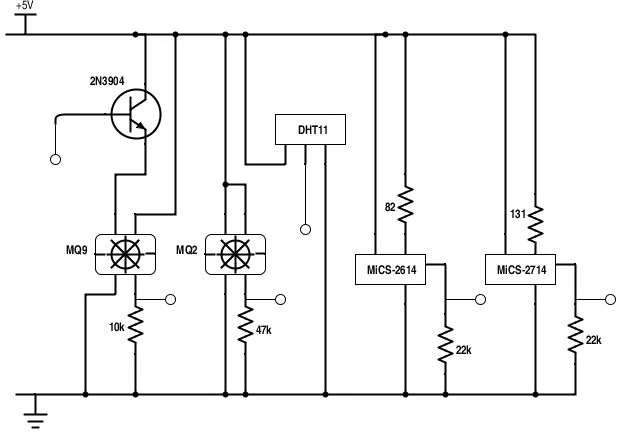
Step 2: Overall Circuit Diagram
The circuit diagram above is the entirety of this pollution detector works. A detailed circuit diagram for the solder board follows later. Note that you can change most of the digital ports and analog ports that sensors enter should you need to do so (for any reason); this will only require that you edit the code we have provided to account for these changes.
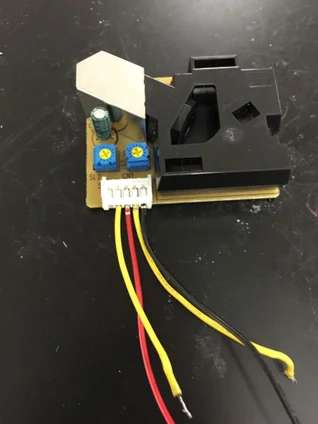
Step 3: Particulate Matter Sensor
We use two Shinyei PPD42 Dust Sensors to collect data about particulate matter.
Each Shinyei Detector has two signal outputs: one for small particulate matter (left yellow wire in the picture above) and one for larger particulate matter. These output signals are connected the digital inputs of the Ardiuno. The detector needs to be powered by supplying +5V and ground to the ports on the detector. See the overall circuit diagram for details.
Each detector uses an infrared LED and a photodetector to measure scattering off of small airborne particulates. Internal circuitry turns the photodetector output into digital output signals. Generally the sensor outputs a +5V signal, when it detects particles is sends out a low-voltage pulse. The fraction of the time that the output signal is low or the “low-pulse occupancy percentage” is proportional to the concentration of particulate matter in the air.
A detailed reverse engineering analysis of the Shinyei PPD42 by Tracy Allen can be found at http://takingspace.org/wp-content/uploads/ShinyeiP…
Step 4: Gas Sensor Circuit Board
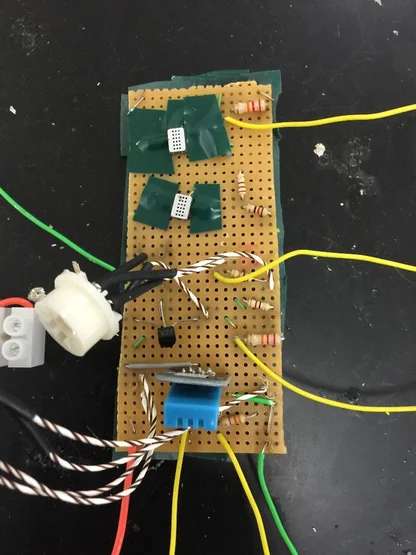
Above is the circuit diagram for the circuit board hosting the gas sensors and temperature/humidity sensor. Details about mounting each of the separate devices are in the following steps. Note that your circuit board can look different from ours physically. In fact, we recommend you print a circuit board for the surface mount devices instead of using a solder board. It should work just as well as long as you follow the circuit diagram.
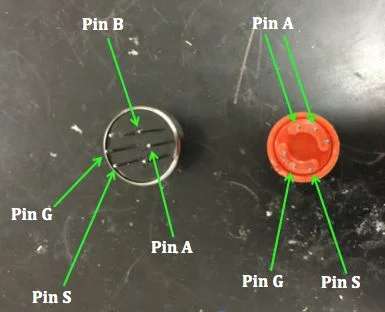
Step 5: Ozone and NO2 sensors
We use surface-mount sensors MiCS-2614 and MiCS-2714 to detect Ozone and Nitrogen Dioxide respectively.
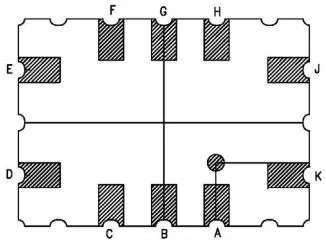
Both of these devises use an internal resistor as their sensing element. The sensing resistor is connected between the pins (G) and (K) in the diagram above. Use an ohmmeter to check that you have found the right pins. The resistance should be on the order of 10-20 kΩ.
Both devices also have a heating element between pins (A) and (H). This heating element keeps the sensing element at the appropriate temperature. The resistance of the heating element is 50-60Ω.
Ideally these devices should be surface mounted onto a circuit board. However, in the absence of a circuit board printer it is still possible to carefully solder to the back of these devices using very low temperature solder and much care.
As shown in the solder board circuit diagram, we place the 82Ω resistor and the 131Ω resistor in series with the heating elements of the MiCS-2614 and MiCS-2714 units respectively. This ensure that the heating elements receive the proper level of power. If you don't have access to a 131Ω resistor (it is not a standard value) use a 120Ω resistor and a 12Ω resistor in series.
We place the sensing resistors in both devises in series with 22kΩ resistors to create a voltage divider. From the voltage at the output of the voltage divider we can calculate the sensing resistance.
Rsenor = 22kΩ * (5V / Vout – 1)
Air Pollution De
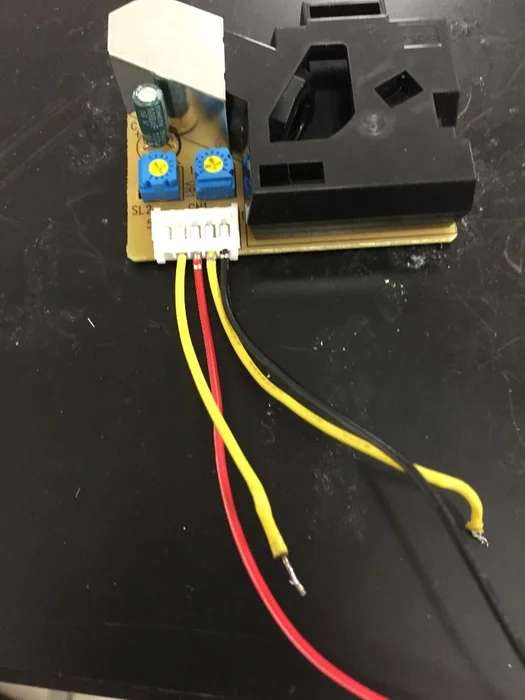
Step 6: MQ Toxic Gas Sensors
We used MQ-2 and MQ-9 gas sensors to measure toxic gasses including Propane, Butane, LPG and Carbon Monoxide.
The MQ-2 and MQ-9 are very similar to the MiCS detectors. They use a gas-sensitive resistor (SnO2) to detect concentrations of toxic gases and have an internal heating element to keep the sensor at the right temperature. The circuits we use for these devises are practically the same as the circuits for the MiCS sensors, except that we use a transistor rather than a resistor to regulate heater power in the MQ-9.
Refer to the solder board circuit diagram for mounting details. For the MQ-2 sensor, connect the pins marked A to the 5V power, connect the pin marked G to ground, and connect the pin marked S is connected to ground in series with a 47 kΩ resistor. For the MQ-9 gas sensor, connect the pin marked A to the transistor, the pin marked B to the 5 V power, the pin marked G to ground, and the pin marked S to ground in series with a 10 kΩ resistor.
Step 7: Temperature and Humidity Sensors
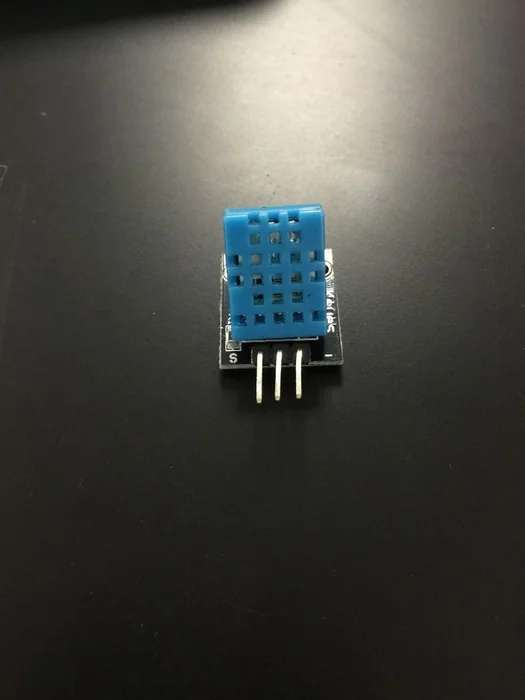
This sensor is provided because temperature and humidity play a role in the gas concentrations that our sensors detect. High humidity and temperature as well as dramatic changes in either would have detrimental effects on the accuracy of readings It is therefore helpful to be able to monitor these variables. Both temperature and humidity can be read from this single sensor. Oriented as it is in the photo above, the left pin is to be attached to power, the middle pin is the output signal, and the right pin is grounded. The output signal for this component goes to a digital port on the Arduino. Our code is set up such expecting the temperature signal in digital port 2. This can be changed to another digital port should you need to; simply alter the code in accordance to what port you have chosen. Refer to the solder board diagram to use this component.
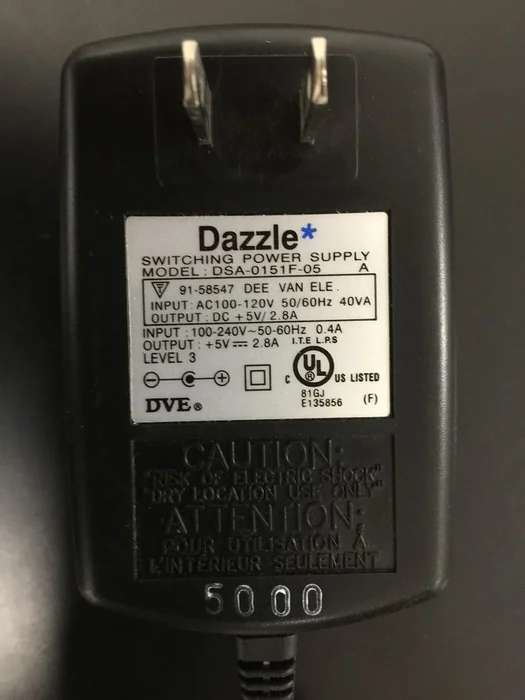
Step 8: Power and Fan
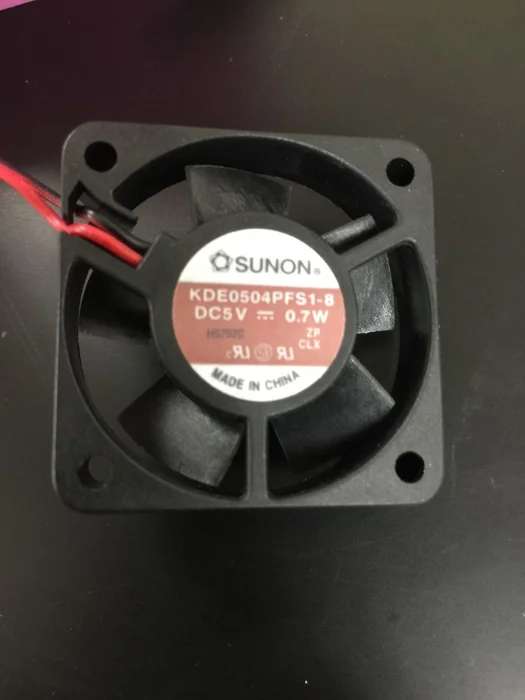
If you look at the circuit diagram for the entire project, you will see that we need only one input voltage of 5 V. A common adaptor like the one shown above can be used to power the project. Furthermore, you will need a fan to ensure airflow through the box and prevent overheating. We used the fan above but any fan that uses 5 V and is of the appropriate size can be used.
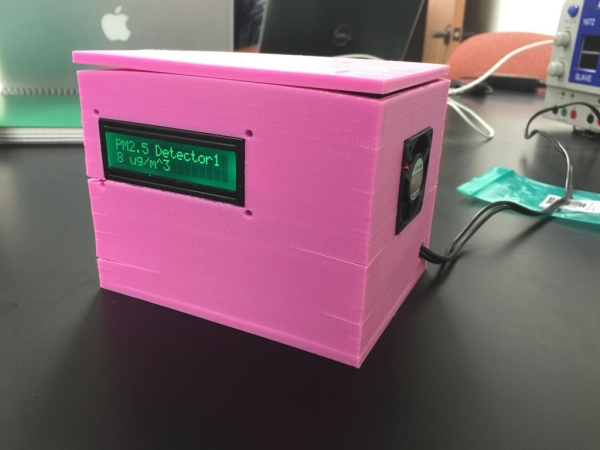
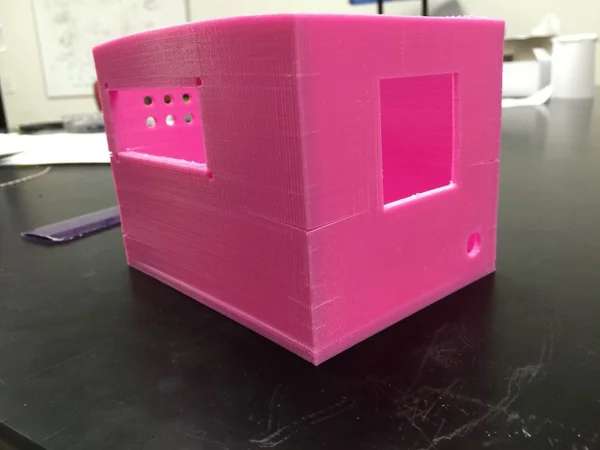
Step 9: Container
While there are many ways to make an effective box, we chose to use an UP 3D printer for our box. We have attached the STL that we used for the final printing.
Step 10: Coding
The code for extracting raw data from the device is attached above. This code will print the sensor resistance values, Shinyei PPD42 low-pulse occupancy percentages, and temperature and humidity readings to the computer via the serial monitor. It will cycle through the raw data on LCD screen as well.
In order to make the code work you will first need to download the libraries for the LCD shield and temperature and humidity sensors. You will find the libraries at the following websites
LCD shield code: https://learn.adafruit.com/rgb-lcd-shield/using-th…
Temperature and humidity sensor code: https://github.com/adafruit/DHT-sensor-library
Step 11: Interpreting the Data
We are in the process of determining how to transform raw sensor values into meaningful outputs. Calibration against known pollution sources will eventually be necessary to ensure accuracy. In meantime we have used sensor data sheets and prior research to make approximations.
To estimate particulate matter concentrations we use information from a research paper by David Holstius. The paper correlates the Shinyei PPD42 dust sensor outputs with EPA measurements. The graphs in the appendix show best fit lines for the data. We used the graphs to approximate PM2.5 concentration in micrograms per cubic meter as:
PM2.5 = 5 + 5 * (small PM low-pulse occupancy percentage)
To estimate gas concentrations from MiCS gas sensors, we use the graphs in the datasheets (NO2 and O3) to extract functions relating sensor resistance to gas concentration.
For MQ sensors we use the graphs on the device datasheets to qualitatively assess the data. When the resistance value drops to less than half of the resistance in air, it is likely that the devise is detecting the target gasses. When resistance drops by a factor of 10, the levels of target gas are likely around 1000 ppm, close to the legal safety limit.
Once we obtain approximate concentrations of the target gasses, we defer to US government standards to interpret the data. We primarily use the EPA Technical Assistance Document for the Reporting of Daily Air Quality and a CDC information sheet on the hazards of propane.
Unfortunately our code that interprets the raw data is not yet fully functional. We hope to be able upload it at a later date.
Source: Air Pollution Detector