
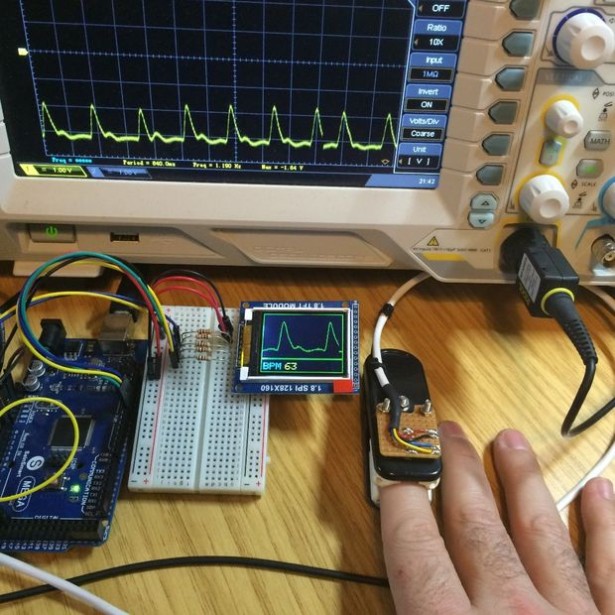
This Instructable documents how to create a simple heart rate monitor using Photoplethysmography with an IR phototransistor via transmissive absorption using the Arduino to process the pulsatile data and display live results via a TFT screen.
To use the source code and create the necessary circuitry you will need a reasonable grasp of electronics, knowledge of the Arduino, a DMM and some patience.
The design has been optimised to work with easily obtainable ‘off the shelf' commercial parts and re-purposed household items and gives reasonable results.
You will need the following parts;
Arduino Mega 2560 (from SainSmart)
1 off old coat hanger as depicted in the picture in Step 2 : The Sensor
1 off 1.8 SPI 128×160 TFT Module. I got mine for £2.79 from ebay. Here; http://www.ebay.co.uk/itm/1-8-Serial-SPI-TFT-LCD-Module-Display-PCB-Adapter-Power-IC-SD-Socket-128×160-/381339124956?hash=item58c99544dc:g:mqcAA0SwjvvvsM13
2 off TL072 FET OpAmps
1 off T121 NPN Darlington Transistor
3 off 1N4148 diodes
1 off BZY88C 3v3 Zener diode
1 off BPW96B Phototransistor
1 off TSAL6400 940nm IR 5mm Led
1 off Ceramic 1uF capacitor
2 off 4.7uF Electrolytic capacitors
1 off 22pF Ceramic capacitor
1 off 22nF Ceramic capacitor
1 off 10nF Ceramic capacitor
1 off 50K 10 turn potentiometer
3 off 4K7 resistors
4 off 10R resistors
2 off 7R5 resistors
1 off 1M0 resistor
1 off 3K9 resistor
2 off 10K resistors
1 off 100K resistor
5 off 1K resistors
1 off 220R resistor
Other than the Arduino Mega 2560 (Genuino), coat hanger and the TFT display, I purchased all the parts from FARNELL in the UK.
.
WARNING : The details contained herein are for information only and should not be relied upon for accurate heart rate monitoring in a clinical or any other environment.
Step 1: Now for the science part!
Picture of Now for the science part!
So what is Photoplethysmography?
Photoplethysmography (PPG) is a simple and low cost optical technique that can be used to detect blood volume changes in the microvascular bed of tissue. It is used to make non-invasive measurements at the surface of the skin.
A PPG waveform comprises two main components; ‘AC' arterial pulsatile changes in blood flow synchronised to heart beat and ‘DC' elements attributed to venous blood, tissue, respiration, sympathetic nervous system activity and thermoregulation. See diagram above ‘Variation in light attenuation by tissue'.
It is these AC changes which are used to extract heart beat.
The interaction of light with human tissue is quite complex and involves; scattering, reflection and absorption. Research has shown that IR light around 940nm gives the deepest penetration and yields the best deep tissue blood flow measurement. See https://www.youtube.com/watch?v=2v3rae-73jc
Detection is achieved by shining a source of illumination (in this case an IR LED) at an optically sensitive receiver (photodiode/phototransistor).
Positioning of sensors is in one of two ways, reflective or transmissive. See diagram above ‘Transmissive and Reflective modes'. Transmissive mode yields the best results with IR illumination, which is what this project is based around.
Step 2: The Sensor
The sensor was constructed from an old clothes hanger.
I initially used the sprung metal clip to secure the device to the finger tip, but found it too tight in it's original form, blocking blood flow.
Consequently I opened it up as shown above.
However, once I had opened it up sufficiently to allow for good blood flow in the finger tip, the clip would no longer hold together.
To overcome this I drilled two holes in the steel clip and used M2.5 allen screws to attach it to the sensor platform. Note: As the spring comprised hardened steel I needed to heat it up with a gas blow torch to soften the metal first. You can see the resultant discolouration in the image above.
Once the clamp had been created I drilled 5mm holes into the top and bottom sensor platforms (you may notice there are two holes in one of the plates, this is because I has initially started out trying to calculate Sp02 Max. and required leds of differing wavelength. I quickly determined the electronics and signal processing is probably going to be out of the scope of Instructables. Maybe for another time).
With the holes in place I added ‘P' foam used as draft insulation on doors, to give lateral cushioning of the inserted digit and attenuate any incident light from hitting the phototransistor.
Finally I mounted the IR led and Phototransistor on some custom cut veroboard fixed to the sensor platform with M3 screws such that it gives reasonable strain relief for the attached cables.
Step 3: Signal Conditioning
Picture of Signal Conditioning
General
In designing the circuit for the detector I went through many iterations and tried many types of detectors. From photodiodes in both photovoltaic and transconductance mode. Reflective and transmissive sensing methods. With many different sources of illumination including Red 650nm, Green 535nm and IR 940nm.
I finally settled on using a phototransistor with a 940nm IR source being reasonably well matched spectrally as this made the electronics the simplest by ‘far'.
As I mention above, the choice of both phototransistor and IR source was specific (stick to what is in the circuit diagram) as this was the best ‘off the shelf' match I could obtain.
Description of Circuit
The source IR led (LED1) is illuminated via a constant current arrangement (D1..D3, R5, R6, R18…R21 and T1). The components were chosen to give approximately 100mA through the led. For the TSAL6400 this is the maximum you can drive this led at. It does get warm over time if left on for prolonged periods, though the manufacturers data sheet indicates this is acceptable.
Capacitors C4 and C5 are present to provide supply rail decoupling.
As the Arduino ADC is unipolar, to maximise signal swing I created a False Ground (FG) via IC1A connected as a unity gain buffer amp fed by a constant voltage source formed with ballast resistor R8 and a 3.3V zener diode D5 (3.3V is the most optimal value to give low cost and low drift). So as not to load R8 a 50K pot is used to tap off the reference feed to IC1. C1 is there to prevent any transients from appearing on R4, given 50K is quite a high value.
This false ground feeds the signal conditioning chain connected to the IR sensor T2.
To maximise output from T2 it is coupled across the GND and +5V rails. The emitter resistor R1 was chosen empirically (though is within the manufacturers typical dedicated characteristics for collector light current) so as to give the best response. The emitter of T2 is AC coupled to IC1B and inverting amp via C2 a 1uF ceramic capacitor. The TL07X opamp was chosen as it has a high impedance FET input stage and will minimally load the output of T2. IC1B provides high gain amplification of the photodiode signal. C3 is used to provision some attenuation of transients. The typical output from this amp is given above (note the mains ‘hum' on the signal).
R10 and C6 form a simple single pole Low Pass Filter with a break frequency of approximately 3.38Hz or 200BPM. This provides antialiasing for the ADC and mains supply rejection. The typical output for this is also given above (note the improved signal).
IC2A is a non-inverting unity gain buffer used to prevent loading by the next stage.
IC2B is an inverting amp with a gain of approximately 10. It scales the signal such that it will typically by 20% of the supply rail to allow for offset drift. It also allows for easier processing and display in the Arduino once read by the ADC. One less calculation to make.
Calibration
To calibrate the circuit ensure +5V supply is applied, T1 is switched ‘off' and the sensor is shielded from any light. Adjust R4 until output of IC2B is as close to 2.5V as possible.
Practical notes on construction
If you do decide to create this project then here are some things to watch out for;
Use coax to connect to the Phototransistor as in the diagram above. Reduces signal loss and noise.
Ensure there is no solder flux is present between the Emitter and Collector of the photodiode as this can attenuate the signal.
Provide supply via a high capacity battery or good linear PSU (noise free, steer clear of switched mode supplies).
Separate the Arduino from the initial stage of the analogue signal conditioning as far as is practically possible. High speed clock noise from the processor can induce noise in the signal path.
Keep wire lengths as short as possible.
Shroud both your illumination source and sensor as much as is practically possible.
Ensure the sensor clamp is ‘sufficient' and not tight on the finger. Too tight will block blood flow and attenuate the readings.
For More Details: Photoplethysmography – (IR Heart Rate Monitor)