
Ever wanted to monitor your city's Current Weather Conditions, Carbon Footprint, Noise and Pollution levels? Do you want be a Climate Change Crusader or set-up your own Tweeting Weather Station and share your local weather conditions with the world?
Meet Tweeting Weather IoT Station aka TWIST – a DIY, Open-Source Environmental Monitoring and Meteorological Data Acquisition Platform. The purpose of TWIST is so that individuals and communities can collect data of what's actually happening in their environment and share this data on social media such as Twitter.
TWIST is an Internet of Things (IoT) powered platform.
The brain of TWIST is an Intel Edison Board.
TWIST is compatible with a variety of sensors.
All code, design files(schematics & PCB layout) are Open-Source. This means that anyone can contribute to the TWIST platform by sharing code and schematics for different sensors.
TWIST consists of three technological layers:
The first layer is a hardware board that contains all the weather and environmental sensors known as the ‘Sensor Board'. As the name suggests, it carries sensors that measureair composition, temperature, humidity,rain. Additional sensors likeseismic activity, UV index, barometric pressure, altitude, lux(luminosity), sound levels, wind speed & direction,etc can also be added. Once it’s set up, the Sensor Board is able to stream data measured by the sensors to the second layer. The second layer is the Intel Edison Board that receives data from the Sensor Board, processes it and sends it to the next layer. The third layer connects your Edison Board to the Internet over Wi-Fi using the wireless module on the Edison board and Tweet's the Current Weather & Environmental conditions.
Power to the device can be provided by a solar panel or an AC Adapter.
Version controlled repositories
All three technological layers of TWIST are Open-Source, and thus all the files we use for code, PCB development, mechanical design,etc are readily available on our Github repository.
Contest Entries
Intel IoT Invitational
I would like to thank Intel+Instructables for providing me with the Intel Edison Board. I plan on making many more IoT related Instructables using the Edison board.
#iotweatherstn
If you make TWIST, don't forget to tweet the weather using #iotweatherstn. #iotweatherstn can be a hashtag used by all IoT powered Tweeting Weather Stations.
Step 1: Parts and Materials
Picture of Parts and Materials
Image 4.png
Image 5.png
Image 6.png
Image 1.png
Quantity Part Details
1 Intel Edison with Arduino Breakout Board
1 MQ2 Combustible Gas Sensor
1 YL-83 Rain Sensor
1 SL-HS-220 Temperature & Humidity Sensor
1 Resistor 32K
1 Resistor 4.7K
2 Wood Sheet A4 Size(Can later be cut into size)
3 Metal Standoff 1inch
Step 2: Electrical Design
Power
The entire system is powered from a 5V 1A power supply. The sensors(Temperature,Humidity,Rain,Gas) draws approximately 200 mA, the Edison around 500 mA, Since the total current required is less than 1amp, a 1 amp supply should work just fine. The inbuilt green LED on digital pin 13 of the Edison Board is used to show the power status.
Control
An Intel Edison runs the show for TWIST. The Edison is mounted on an Arduino breakout board, which makes it easy to read the digital & analog signals from the sensors. The Edison is connected to the 5V rail via a micro usb cable. The Edison has a built-in Wi-Fi radio, which allows it to connect to the Twitter without the need for any additional hardware.
Real Time Clock(RTC)
Since the time-stamping automatically carried out by Twitter for each tweet has a resolution limited to the number of total days since the time of Tweeting, a real time clock is used to accurately time stamp the date and time in the Hour-Minute-Second format. The real time clock used in the TWIST platform is the DS-1307 RTC module.
Sensors
The most basic setup of this system has four sensors(Temperature,Humidity,Rain,Gas) that connect to the Edison. Additional sensors can be added such as Noise, Wind,etc. Each sensor is directly powered from the 5V rail and has its signal pin connected respectively to analog pins A0 through A2 and digital pin 2 on the Edison breakout board. The sensors also each have a sensitivity adjustment potentiometer mounted on each sensor board; The MQ-2 is a combustible gas sensor (liquified petroleum gas, propane, hydrogen, and methane) that outputs an analog voltage proportional to the concentration of gases in parts per million. The SL-HS-220 has a thermistor that gives the temperature value. Since the output of the thermistor is non-linear, the corresponding temperature table is given in the sensor repository. The thermistor requires a voltage divider circuit when connected to the Edison Board as shown in the circuit diagram. The SL-HS-220 also has an inbuilt hygrometer which measures humidity and outputs an analog voltage that corresponds to a fixed humidity value. The humidity-voltage table is also given in the sensors repository. A common substitute to the SL-HS-220 is the DHT11 sensor. The rain sensor/water sensor has a potentiometer which is adjusted to give a digital output for a certain amount of rain whose sensitivity can be adjusted by the user.
Pressly.fzzWeather Station.fzz
Step 3: Mechanical Design
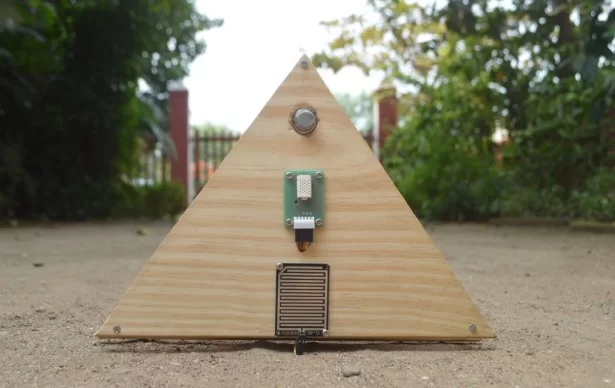
The body of the TWIST is made out of two plates of wooden sheets. Although I used 1/4″ plywood , the design can be assembled out of any sheet material as the spacing (maintained by 1″ aluminum standoffs) is the only critical element. I've attached the vector files for download above.
Laser Cutting
For all those who wish to laser cut the two plates, I have attached the laser cutter files for download below. It also includes an additional air quality sensor in its design. So you can either use an MQ2 sensor module or air quality sensor module depending on your choice.
Weather Stantion Vector.dwgWeather Stantion Vector.dwg
Step 4: Frame Assembly: Face & Base
Faceplate
The Sensors fit into their matching holes and cut-outs and can be fixed using screws or glue.
Baseplate
The standoffs of the Edison board are screwed on to the Baseplate. The analog-to-digital-converter(ADC) which is connected to the rain sensor can also be screwed on to the Baseplate.
Additional components like buzzers or the voltage regulator circuit for the solar input can also be screwed on to the Baseplate.
The Baseplate and the Faceplate are both separated by 1″ standoffs.
Step 5: Electronics & Sensor Assembly
Power
The power for the system is provided by a wall adapter with a standard barrel jack which is connected directly to the Edison's Barrel connector. The system can also be powered through the USB port on the Edison board. You can also power the board from an external Solar panel.
Sensors
The sensors are attached to breakout boards with male headers and hence they can be directly connected to the Edison via male-to-female jumper wires.
Step 6: Twitter Configuration
Inorder to Tweet, we are using a third-party app developed by NeoCat that gets the Twitter token you will need to Tweet with your Edison board. Tokens can also be sourced from Twitter's Developers webpage.
So, to get started, visit NeoCat's website, follow his/her tutorial to get the twitter library and your twitter token. As NeoCat mentioned on their site, please don't abuse the service. Keep your tweets sparse. If you need something that tweets every 6 seconds, you should set up your own server and twitter app and hence the code that I wrote ensures that NeoCat's server doesn't overload(TWIST tweets every 6 hours).
The library uses this NeoCat's website as a proxy server for OAuth stuff. Your tweet may not be applied during maintenance of this NeoCat's website. Twitter seems to reject repeated tweets with the same content (returns error 403).
Twitter Token
Arduino Tweet Library
Step 7: Software & Configuration
Follow Intel's setup guide for the Intel Edsion before you start coding.
The program is an Arduino sketch running on the Edison. I have explained each of the main blocks of code below.
The code includes some predefined constants, pin declarations and a couple of serial print statements that help in troubleshooting.
Tweet Delay
Since Twitter filters out tweets that have the same content and are tweeted within short periods of time between each of them, a standard 3 hour (10800000 milli second) delay between each tweet has been set.
tweetMessage();
delay(10800000);
Type Casting
A lot of the readings we get from the sensors are in the ‘int' or ‘float' datatype. But since we are tweeting these values, we need to convert them into a ‘String' datatype. For this we use a special Type-casting technique.
char *dtostrf (double val, signed char width, unsigned char prec, char *sout) {
char fmt[100];
sprintf(fmt, “%%%d.%df”, width, prec);
sprintf(sout, fmt, val);
return sout;
}
Twitter Token
The twitter token is created on NeoCat's website and should be pasted into the token space here.
void tweetMessage() {
Twitter twitter(” ENTER TWITTER TOKEN HERE “);
Tweeting Sensor Values
In order to tweet the sensor value we first include the Sensor type; Example: “Humidity”. This followed by a character declaration and a line of code required for typecasting. Next we add a statement for the unit of measurement; Example: “%RH”. We can keep on adding values of other sensors too in a similar manner.
humidity(); float humid;
//Twitter message
String stringMsg = “Humidity:”;
char tmp[10];
dtostrf(humid, 1, 2, tmp);
stringMsg += tmp;
stringMsg += “%RH”;
Weather Station Location & Tagging
Next we tag the location(City,Locality,etc) and other tags like #iotweatherstn .
stringMsg += ” #Mumbai #Bandra #iotweatherstn “;
Real Time Clock (RTC)
As explained earlier TWIST can also Tweet the Real Time Clock Data. Below is an example of the ‘day' parameter block of code of the RTC. The Real Time Clock feature is optional in the TWIST platform since the module comes separately. Hence there is a separate branch created in the TWIST repository for the code and schematics of the Real Time Clock branch.
TwistDateTime();<br> DateTime now = rtc.now();
int twistday, twistmonth, twistyear, twisthour, twistmin, twistsec;
String stringMsg = “”;
char ds1307day[10];
dtostrf(twistday,1,0ds1307day);
stringMsg += ds1307day;
stringMsg += “/”;
140 Character Limit
This block of code coverts the string array to 140 character array ready to tweet.
char msg[140];
stringMsg.toCharArray(msg, 140);
Message & Connection Troubleshooting
This block of code prints out a couple of lines of text in the Serial Monitor to help the user check the message and tweet status.
//Tweet that sucker!
if (twitter.post(msg))
{
int status = twitter.wait();
if (status == 200)
{
Serial.println(“OK.”);
Serial.println(“Message Tweeted”);
}
else
{ //Connection Test
Serial.print(“failed : code “);
Serial.println(“Message not Tweeted”);
Serial.println(status);
}
}
else
{
Serial.println(“connection failed.”);
Serial.println(“Message not Tweeted”);
}
All the other blocks of code simply converts the analog or digital reading from the sensors into usable data.
The code can be dowloaded from here or from the main repository:
Wather Station.inoWeather Station.ino
Step 8: Contributing to the Sensor Repository
TWIST currently supports the sensors listed below. Follow the instructions below to learn how you can contribute and add more sensors to the TWIST platform. You can also find the Real Time Clock and other features repository status in the table below.
Sensor Type Sensor Model Repository Status
Temperature & Humidity SL-HS-220 Completed
Gas MQ2 Completed
Rain YL-83 Completed
Temperature & Humidity DHT11 Completed
Digital Luminosity/Lux/Light TSL2561 Completed
UV/IR/Visible Light SI1145 Completed
Sound Level LMV324 Completed
Barometric Pressure & Altitude MPL3115A2 Completed
Wind Speed Anemometer Completed
Real Time Clock (RTC) DS1307 Completed
The TWIST sensor Repository is Open Source meaning anyone can contribute to the code of existing sensors which are in the repository. Additional sensors can also be added to the repository.
For now the three basic sensors(SL-HS-220,MQ2,YL-83) are in the same repository since they are the basic sensors.
If you have a sensor in mind that is not already in the repository, you can write the code and schematics for it and contribute to the repository. Or else you can simply leave the name and model along with a link to the sensor in the comments section below and I will surely check it out and try my best to add it to the repository.
TWIST Sensor Repository
HTML tutorialHTML tutorialHTML tutorial
As more people suggest and contribute to the TWIST sensor repository I will update the above table. Completed- indicates that the code and schematics for that particular sensor is fully ready for use and can be implemented into the TWIST system. Beta- indicates that work has been started by either me or another contributor on the code and schematics for that particular sensor. Proposed- indicates that someone has proposed a sensor to be added to the repository & that work hasn't yet been started on the sensors code or schematics.
Code
If you are contributing towards a particular sensors repository by writing code, ensure that you write it the Arduino IDE or Intel Edison IDE and attach the respective file. The code must include the following features:
Pin Declarations,Libraries, Reading Sensor Values, Serial Printing Sensor Values, Tweeting code for Sensor.
Also include the links to all the additional Libraries used in the code.
Ensure that each block of code has the necessary comments for ease of use.
Also include a possible link to the sensors datasheet for further reference for other contributors.
Schematics
If you are contributing towards a particular sensors repository by drawing schematics, ensure that you do this in either the Fritzing or Eagle PCB design softwares. A Breadboard view will be really helpful for people who have beginner level electronic skills. You can also include a PCB view for those wishing to make their custom sensor breakout boards or PCB's. Also include a possible link to the sensors datasheet for further reference for other contributors.
Mechanical Design
You can also contribute to the vector files and laser cutter files for a particular sensor and add those files to the sensors repository. Standard file formats should be used for this purpose.
3-month Pro Memberships remaining: 10/10
beyondal
6 months ago
Alternative for Edison?
Jonathanrjpereira (author) beyondal
6 months ago
Instead of recommending another board, I'll give you a couple of reasons why I used the Edison for this project:
1. The Edison runs Yocto Linux with development support for Arduino IDE, Eclipse (C, C++, Python). In other words it has a broad range of compatible programming languages.
2. The Intel Edison XDK has also support for HTML5 and NodeJS. This means that you can create a website/web base app that can display the weather from your TWIST. It increases the functionality and adaptablility of TWIST by integrating it with other websites apart from Twitter.
3. The availability of multiple programming languages & web based functionality makes easier to create API's for TWIST and other projects too.
4. In the future I plan on using the XDK to develop and API for TWIST.
5. The Intel Edison Dashboard also allows you ti display the sensor data in the form graphs and charts.
6. You can incorporate the tiny Edison module(excluding the breakout board) on your custom PCB's without loosing the WiFi or Bluetooth functionalities. This also helps large scale manufacturing or mass producing
Jonathanrjpereira (author) Jonathanrjpereira
You should store the analog value of the sensor's output in a variable. And then send the value of that variable to Twitter.
For example:
float X= analogRead();
Why wont this compile? I'm trying to incorporate the DHL11 sensor:
#include <Twitter.h>
#include <SPI.h>
#include “DHT.h”
#include <Ethernet.h>
#undef int() //inorder to make the stdlib.h work
#include <Stdlib.h>
float thermsen = A0;
float humidsen = A1;
int rainsen = 2;
int indicator = 13;
#define Humidity
#define DHTPIN 3
#define DHTTYPE DHT11
DHT dht(DHTPIN, DHTTYPE);
#define MQ_PIN (2) //define which analog input channel you are going to use
#define RL_VALUE (4.7) //define the load resistance on the board, in kilo ohms
#define RO_CLEAN_AIR_FACTOR (9.83) //RO_CLEAR_AIR_FACTOR=(Sensor resistance in clean air)/RO,
//which is derived from the chart in datasheet
/***********************Software Related Macros************************************/
#define CALIBARAION_SAMPLE_TIMES (50) //define how many samples you are going to take in the calibration phase
#define CALIBRATION_SAMPLE_INTERVAL (500) //define the time interal(in milisecond) between each samples in the
//cablibration phase
#define READ_SAMPLE_INTERVAL (50) //define how many samples you are going to take in normal operation
#define READ_SAMPLE_TIMES (5) //define the time interal(in milisecond) between each samples in
//normal operation
/**********************Application Related Macros**********************************/
#define GAS_LPG (0)
#define GAS_CO (1)
#define GAS_SMOKE (2)
/*****************************Globals***********************************************/
float LPGCurve[3] = {2.3, 0.21, -0.47}; //two points are taken from the curve.
//with these two points, a line is formed which is “approximately equivalent”
//to the original curve.
//data format:{ x, y, slope}; point1: (lg200, 0.21), point2: (lg10000, -0.59)
float COCurve[3] = {2.3, 0.72, -0.34}; //two points are taken from the curve.
//with these two points, a line is formed which is “approximately equivalent”
//to the original curve.
//data format:{ x, y, slope}; point1: (lg200, 0.72), point2: (lg10000, 0.15)
float SmokeCurve[3] = {2.3, 0.53, -0.44}; //two points are taken from the curve.
//with these two points, a line is formed which is “approximately equivalent”
//to the original curve.
//data format:{ x, y, slope}; point1: (lg200, 0.53), point2: (lg10000, -0.22)
float Ro = 10; //Ro is initialized to 10 kilo ohms
char stringMsg;
void setup() {
Serial.begin(115200);
pinMode(A0, INPUT);
pinMode(A1, INPUT);
pinMode(2, INPUT);
pinMode(13, OUTPUT);
/**********************************************************/
Serial.print(“Calibrating…\n”);
Ro = MQCalibration(MQ_PIN); //Calibrating the sensor. Please make sure the sensor is in clean air
//when you perform the calibration
Serial.print(“Calibration is done…\n”);
Serial.print(“Ro=”);
Serial.print(Ro);
Serial.print(“kohm”);
Serial.print(“\n”);
dht.begin();
}
void loop()
{ dht11();
float h;
float t;
float f;
//Humidity
stringMsg += “Humidity:”;
char dht11humidity[10];
dtostrf(h,1,2,dht11humidity);
stringMsg += dht11humidity;
stringMsg += “%RH”;
//Temperature Celsius
stringMsg += ” Temperature:”;
char dht11celsius[10];
dtostrf(t,1,2,dht11celsius);
stringMsg += dht11celsius;
stringMsg += “°C”;
//Temperature Celsius
stringMsg += ” Temperature:”;
char dht11farhen[10];
dtostrf(f,1,2,dht11farhen);
stringMsg += dht11farhen;
stringMsg += “°F”;}
//Manual Type-casting for sensor readings
char *dtostrf (double val, signed char width, unsigned char prec, char *sout)
{
char fmt[100];
sprintf(fmt, “%%%d.%df”, width, prec);
sprintf(sout, fmt, val);
return sout;
}
{
tweetMessage();
delay(3000);
}
//Manual Type-casting for sensor readings
char *dtostrf (double val, signed char width, unsigned char prec, char *sout)
{
char fmt[100];
sprintf(fmt, “%%%d.%df”, width, prec);
sprintf(sout, fmt, val);
return sout;
}
//Twitter Message
void tweetMessage() {
Twitter twitter(“4310592022-mfWjQTbSIQy9lFni7EZxcp93d1JRzyR4vtWrmno”); //Twitter Token
humidity();
float humid;
//Twitter message
String stringMsg = “Humidity:”;
char tmp[10];
dtostrf(humid, 1, 2, tmp);
stringMsg += tmp;
stringMsg += “%RH”;
temp_now();
int Temperature;
//Twitter message
stringMsg += ” Temperature:”;
char nowtemp[10];
dtostrf(Temperature, 1, 0, nowtemp);
stringMsg += nowtemp;
stringMsg += “°C”;
MQ2printval();
float MQ2tweet;
//Twitter message
stringMsg += ” CO level:”;
char nowMQ2[10];
dtostrf(MQ2tweet, 1, 2, nowMQ2);
stringMsg += nowMQ2;
stringMsg += “ppm”;
if (digitalRead(2) == HIGH)
{
stringMsg += ” Rain Alert”;
}
stringMsg += ” #Betatesting #raintest #IOTweatherstation #Mumbai #Bandra #CarterRoad “;
//Convert our message to a character array //Twiiter Character Limit. Converts/limits message to 140 characters.
char msg[140];
stringMsg.toCharArray(msg, 140);
//Tweet that sucker!
if (twitter.post(msg))
{
int status = twitter.wait();
if (status == 200)
{
Serial.println(“OK.”);
Serial.println(“Message Tweeted”);
}
else
{ //Connection Test
Serial.print(“failed : code “);
Serial.println(“Message not Tweeted”);
Serial.println(status);
}
}
else
{
Serial.println(“connection failed.”);
Serial.println(“Message not Tweeted”);
}
digitalWrite(13, HIGH); // LED Indicator Feedback Code Working.
}
/********Serial print MQ2 Value****************/
void MQ2printval()
{
float MQ2tweet = (MQGetGasPercentage(MQRead(MQ_PIN) / Ro, GAS_LPG));
Serial.print(“LPG:”);
Serial.print(MQGetGasPercentage(MQRead(MQ_PIN) / Ro, GAS_LPG) );
Serial.print( “ppm” );
Serial.print(” “);
Serial.print(“CO:”);
Serial.print(MQGetGasPercentage(MQRead(MQ_PIN) / Ro, GAS_CO) );
Serial.print( “ppm” );
Serial.print(” “);
Serial.print(“SMOKE:”);
Serial.print(MQGetGasPercentage(MQRead(MQ_PIN) / Ro, GAS_SMOKE) );
Serial.print( “ppm” );
Serial.print(“\n”);
}
/****************** MQResistanceCalculation ****************************************
Input: raw_adc – raw value read from adc, which represents the voltage
Output: the calculated sensor resistance
Remarks: The sensor and the load resistor forms a voltage divider. Given the voltage
across the load resistor and its resistance, the resistance of the sensor
could be derived.
************************************************************************************/
float MQResistanceCalculation(int raw_adc)
{
return ( ((float)RL_VALUE * (1023 – raw_adc) / raw_adc));
}
/***************************** MQCalibration ****************************************
Input: mq_pin – analog channel
Output: Ro of the sensor
Remarks: This function assumes that the sensor is in clean air. It use
MQResistanceCalculation to calculates the sensor resistance in clean air
and then divides it with RO_CLEAN_AIR_FACTOR. RO_CLEAN_AIR_FACTOR is about
10, which differs slightly between different sensors.
************************************************************************************/
float MQCalibration(int mq_pin)
{
int i;
float val = 0;
for (i = 0; i < CALIBARAION_SAMPLE_TIMES; i++) { //take multiple samples
val += MQResistanceCalculation(analogRead(mq_pin));
delay(CALIBRATION_SAMPLE_INTERVAL);
}
val = val / CALIBARAION_SAMPLE_TIMES; //calculate the average value
val = val / RO_CLEAN_AIR_FACTOR; //divided by RO_CLEAN_AIR_FACTOR yields the Ro
//according to the chart in the datasheet
return val;
}
/***************************** MQRead *********************************************
Input: mq_pin – analog channel
Output: Rs of the sensor
Remarks: This function use MQResistanceCalculation to caculate the sensor resistenc (Rs).
The Rs changes as the sensor is in the different consentration of the target
gas. The sample times and the time interval between samples could be configured
by changing the definition of the macros.
************************************************************************************/
float MQRead(int mq_pin)
{
int i;
float rs = 0;
for (i = 0; i < READ_SAMPLE_TIMES; i++) {
rs += MQResistanceCalculation(analogRead(mq_pin));
delay(READ_SAMPLE_INTERVAL);
}
rs = rs / READ_SAMPLE_TIMES;
return rs;
}
/***************************** MQGetGasPercentage **********************************
Input: rs_ro_ratio – Rs divided by Ro
gas_id – target gas type
Output: ppm of the target gas
Remarks: This function passes different curves to the MQGetPercentage function which
calculates the ppm (parts per million) of the target gas.
************************************************************************************/
int MQGetGasPercentage(float rs_ro_ratio, int gas_id)
{
if ( gas_id == GAS_LPG ) {
return MQGetPercentage(rs_ro_ratio, LPGCurve);
} else if ( gas_id == GAS_CO ) {
return MQGetPercentage(rs_ro_ratio, COCurve);
} else if ( gas_id == GAS_SMOKE ) {
return MQGetPercentage(rs_ro_ratio, SmokeCurve);
}
return 0;
}
/***************************** MQGetPercentage **********************************
Input: rs_ro_ratio – Rs divided by Ro
pcurve – pointer to the curve of the target gas
Output: ppm of the target gas
Remarks: By using the slope and a point of the line. The x(logarithmic value of ppm)
of the line could be derived if y(rs_ro_ratio) is provided. As it is a
logarithmic coordinate, power of 10 is used to convert the result to non-logarithmic
value.
************************************************************************************/
int MQGetPercentage(float rs_ro_ratio, float *pcurve)
{
return (pow(10, ( ((log(rs_ro_ratio) – pcurve[1]) / pcurve[2]) + pcurve[0])));
}
/******Humidity***********/
void humidity()
{
int humidSensorValue = analogRead(A1);
// Convert the analog reading (which goes from 0 – 1023) to a voltage (0 – 5V):
// Multiply by 1000 so that map() function can work properly. map() does not count numbers after the decimal.
float humidvoltage = humidSensorValue * (5.0 / 1023.0) * 1000;
// When Humidity is 20%RH Voltage is 660mV. When Humidity is 95%RH Voltage is 3135mV.
float humid = map(humidvoltage, 660, 3135, 20, 95);
// print out the value of humidity:
Serial.print(“Humidity:”);
Serial.print(humid);
Serial.println();
}
/**************Temperature*************/
void temp_now()
{
float tempSensorValue = analogRead(A0);
// Convert the analog reading (which goes from 0 – 1023) to a voltage (0 – 5V):
float voltage = tempSensorValue * (5.0 / 1023.0);
// print out the value you read:
//Serial.print(“Voltage(V)= “);
//Serial.print(voltage);
//Serial.println();
int Temperature;
if ((voltage > 2.521) && (voltage < 2.585))
For More Details: TWIST- DIY Tweeting Weather Station