
Connect a particulate matter sensor to a Raspberry Pi and obtain easy-to-read graphs based on the read data using Microsoft Azure.
Building the OS
The first step in using the Raspberry Pi 4 for this project is to build a minimal Linux distribution using the Yocto project.
Clone the Raspberry Pi BSP from https://github.com/agherzan/meta-raspberrypi and checkout the 497a90a commit. Also use the 35364c0ce commit of https://github.com/openembedded/meta-openembedded and the ca701cb92d commit of https://git.yoctoproject.org/git/poky. Build and copy the image to the SD card using the instructions from the repo and test it.
Modify the image by adding to rpi-build/conf/local.conf:
1. IMAGE_ROOTFS_EXTRA_SPACE = "8388608" for extra space;
2. ENABLE_I2C = "1" and KERNEL_MODULE_AUTOLOAD_rpi += "i2c-dev i2c-bcm2708" to enable I2C;
3. CORE_IMAGE_EXTRA_INSTALL += "bash nano tar zip openssh curl ca-certificates ntp tzdata packagegroup-core-buildessential python3 python3-pip i2c-tools git startup-script rustup" to add extra packages.
Further modify the image by adding adding the path to meta-mylayer (from the code section) to BBLAYERS into rpi-build/conf/bblayers.conf, thus adding the following recipes:1. ntp to get the exact time;2. rustup to copy the Rust Language install script to rootfs;3. startup-script to copy and initialize the startup script that connects to Wi-Fi and starts the ntp service;4. tzdata to set the timezone. You have to modify this file for your location;5. wpa_supplicant to configure the Wi-Fi network. You have to modify this file for your network.
Rebuild and copy the image to the SD card.
Connecting the sensor
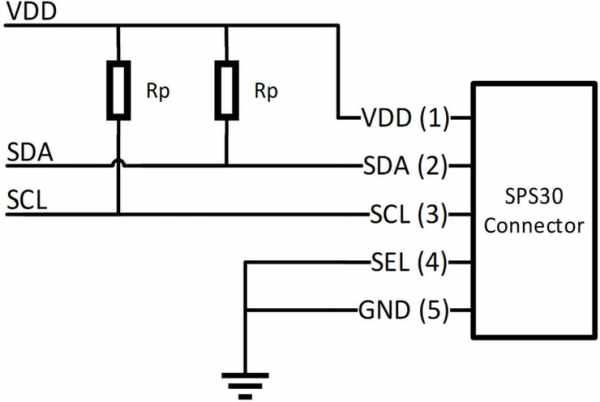
Connect the sensor to the Raspberry Pi 4 using a breadboard and two 10 kΩ resistors, as shown in the sensor's datasheet, at page 16: https://www.sensirion.com/fileadmin/user_upload/customers/sensirion/Dokumente/9.6_Particulate_Matter/Datasheets/Sensirion_PM_Sensors_SPS30_Datasheet.pdf
Also take a look at the Raspberry Pi 4 GPIO pins https://www.raspberrypi.org/documentation/usage/gpio/
Connect:1. SPS30 pin VDD (1) to Raspberry Pi pin 4 (5V power);2. SPS30 pin SDA (2) to Raspberry Pi pin 3 (GPIO 2 (SDA));3. SPS30 pin SCL (3) to Raspberry Pi pin 5 (GPIO 3 (SCL));4. SPS30 pin SEL (4) to Raspberry Pi pin 6 (Ground);5. SPS30 pin GND (5) to Raspberry Pi pin 6 (Ground).
Verify the connection by running i2cdetect -y 1 on the Raspberry Pi and checking that the device with address 0x69 is detected.
Reading data
Install the Rust Language using the Rustup script on the Raspberry Pi.
git clone https://github.com/david-gherghita/sps30-i2c-rs.git to download the driver for the sensor.
Check that it's running correctly by running cargo run --example linux.
Sending data to the cloud
Create an account on the Microsoft Azure platform.
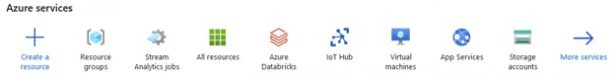
From the Azure Services tab, create a new Resource Group.
Add a new IoT Hub in the Resource Group and navigate to its page.
In the Explorers section, click on IoT devices and add a new device. Note the Primary Connection String as you will use it to connect the board to the cloud.
Compile and run the Rust program from the Code section by using cargo and setting the project's dependencies as below.
linux-embedded-hal = "0.3.0"
sps30-i2c = "0.1.0"
Fill the Primary Connection String, check the path to the Rust program and run the Python program from the Code section.
If everything works correctly, you should the IoT Hub receiving data.
Back to Azure, create a new Stream Analytics job and add a new stream input from the IoT Hub, making sure that the selected Event serialization format is JSON.
In the Input Preview tab, there should be the received values.
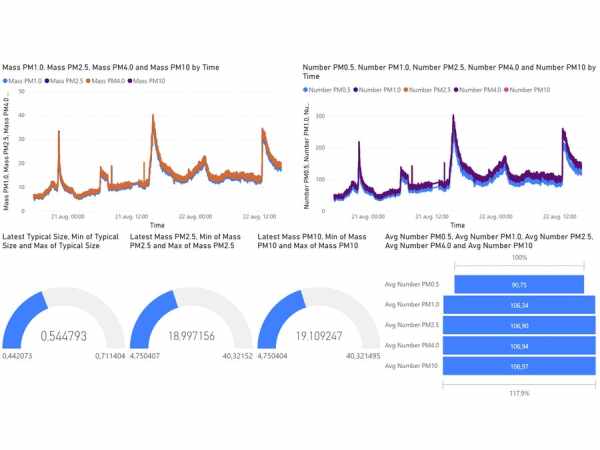
o obtain a more intuitive view of the values in the form of graphs, add an output to the Stream Analytics job of type Power Bi. Be sure to select User Token as the Authentication Mode to be able to use your own workspace as the Group workspace.
Modify the query function to send the data to Power Bi as follows:
SELECT
    "mass_pm1.0",
    "mass_pm2.5",
    "mass_pm4.0",
    "mass_pm10",
    "number_pm0.5",
    "number_pm1.0",
    "number_pm2.5",
    "number_pm4.0",
    "number_pm10",
    "typical_size",
    CAST ("sensor_time" AS datetime) "sensor_time"
INTO
    "AQS-PowerBI"
FROM
    IoT
To finally use the data in Power BI, navigate to its webpage, access your workspace and create a Report based on the dataset from the Stream Analytics job using the simple drag and drop interface.
Source: Air Quality Monitor using Raspberry Pi 4, SPS30 and Azure