
The purpose of this project was to see whether there was any correlation between weather and the color of clothing people chose to wear. We were curious as to what extent the weather affected people's clothing choices. Some individuals may plan out their day accordingly, others may not care at all. We wanted to know roughly how much there was a change of color then.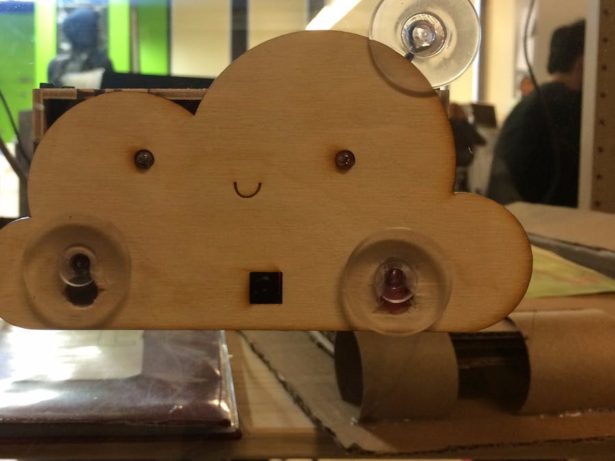
We deployed our project in the window of our Computer Science teacher's classroom; an area with enough foot traffic to gather lots of data. Our project required a camera and needed to be displayed publicly, so we decided to design our enclosure in a way that would be visually appealing to people. Since we were trying to find a correlation between clothing color and weather, the face of the enclosure was fashioned in a way that made it look like a friendly cloud.
Developing the code was a simple process. The camera was set to capture an image every 60 seconds. A .jpg image was captured along with a 3D ndarray (Numpy array) populated with RGB values of the image. The next step was finding the overall average color of the image. In order to save on time, we did a rough analysis of the RGB values by utilizing pixels across a slanted line reaching from the top left to bottom right. Once that was completed, we recorded the average red, green, and blue values along with a time stamp and the image name to a file. Debugging the code was also pretty straightforward. In order to test that the camera was taking pictures every 60 seconds, we would change the loop for image capture to run only two times. The results of the image in the file were checked to ensure that everything was operational.
We faced challenges in both the design and programming process. For the camera, we needed to design and install the device in a manner which would prevent it from falling, and we needed to find a way which would prevent window glare from messing with the image. Our solutions were to place suction pads on the face of the device and mount it straight onto the glass window. By doing this we solved both problems at once. Glare was eliminated from the image, and we no longer had to fear that the device would fall. From the programming side of things, getting the camera to capture to a 3D Numpy (Python package) ndarray and converting the file into a .csv file was a challenge. Due to an unintentional mishap found in the code, the average RGB values we recorded were continuously added up in their own variables instead of resetting to 0 and capturing the new RGB average. This problem is resolved in the csv converter file.
Some knowledge and skill we gained was how to use Inkscape, how to use a laser-cutter, and how to work with a Raspberry Pi. On a broader scale, what we learned here was that a line of communication is necessary between the hardware designers and the software developers, and that careful planning is needed in order to ensure that everything runs smoothly and according to plan.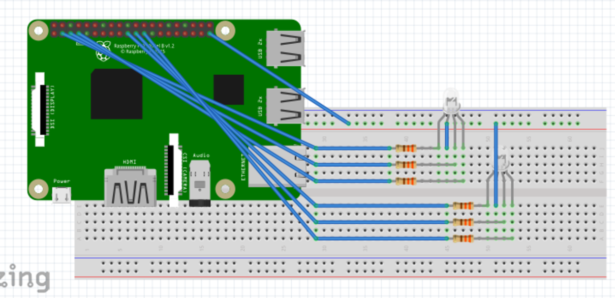
We did not use a PCB for this project. However, one can be used as shown in this sketch.
For more detail: Chromatic Climate: LoT Project