
INTRODUCTION AND MOTIVATION
In the design of modern electronic equipment, energy and power consumption
have become increasingly important. In order to design better products, engineers
need to understand the power behavior of previous products, which they can use to
roughly estimate the performance of new products and future energy costs. It is not
easy to measure power data. There are a variety of issues with existing measuring
equipment, including high initial cost, data inaccuracies, low sampling rate and high
operational difficulty.
The goal of this research is to design a low cost, stable, high resolution, high
sampling rate, and easy-to-use measurement device to collect power consumption
data. These data should be trustworthy and easy to analyze.
1.1 Motivation
Our research group wanted to obtain high-sample rate power measurements and
found this was much more difficult than imagined. Our explorations of this area
show that much work can be done in this field. The research has wider impacts than
just gathering power measurements for our research group. In terms of commercial
design, power savings are always a good thing, from large-scale devices down to
small-scale embedded systems. A typical large-scale computing environment is a
supercomputer. In the Top 500 supercomputer list as of June 2017, the No. 1
Sunway TaihuLight has 10,649,600 cores and uses 15,371 kW of power [2]. Powering
this supercomputer for a day uses electricity roughly equivalent to a month of
electricity consumption for 700 Bangor, Maine, area people [1]. Even if we can only
shave 0.1 Watts of power off of each processor core of this supercomputer, the total
power savings would be significant.
Mobile phones are typical of modern embedded systems; power saving means
that the phone can run for longer. Who does not want their cell phone to last longer
after each charge? Saving power is not always easy. As System on Chip (SoC)
technology advances, saving energy from the hardware becomes more and more
difficult. Many companies have given up on saving energy from the hardware and
try to find a way from software. Saving energy also reduces heat, fan noise, and
provides other benefits. In order to optimize software to consume less power, there
has to be some way to quantify the power usage. Our goal is to provide ways to
gather this information.
1.2 Background
Power and energy are two commonly used physical properties. They represent
different things, but usually can be transformed into each other.
1.2.1 Power
In physics, power is the rate of doing work. It is the amount of energy consumed
per unit time. Electric power is the rate, per unit time, at which electrical energy is
transferred by an electric circuit. The International System of Units (SI unit) of
power is the Watt, one Joule per second. Power is very important in the circuit, not
enough power will stop the circuit, while too much power will overload the circuit.
The electric power in Watts produced by an electric current of I Amperes
consisting of a charge of Q Coulombs every t seconds passing through an electric
potential (voltage) difference of V Volts [7] can be found by:
P =
V ∗ Q
t
= V ∗ I = I
2
∗ R =
V
2
R
where Q is electric charge in Coulombs, t is time in seconds, I is electric current in
Amperes, and V is electric potential (or voltage) in Volts.
In the acquisition of electricity data, sometimes it is difficult to know the exact
resistance of the system, so it is best to use the form of this formula without
resistance to calculate the power.
1.2.2 Energy
In physics, energy is the property that must be transferred to an object in order
to perform work on or to heat the object. Electrical energy is the energy newly
derived from electric potential energy or kinetic energy. The SI unit for energy is
the Joule, but the energy unit used for everyday electricity, particularly for utility
bills, is the kilowatt-hour (kWh); one kWh is equivalent to 3.6 × 10⁶J (3600 kJ or
3.6 MJ) [7].
Energy can be used to measure the total electricity consumption of a device.
The relationship between energy and power conversion is as follows:
E = P ∗ t
1.3 Measurement
In the actual measurement of devices, we mainly focus on power. Power is a key
metric with performance optimization because measuring energy requires the
additional measurement of time, which is more complex. Energy is also important,
but energy and power can be converted to each other. By optimizing for power,
energy can also be optimized.
In order to get more accurate reference data we try to keep the conditions in the
experiment simple. We could face various problems during measurements, including
power supply instability, unknown external device power consumption, and software
interference. It is almost impossible to completely avoid the interference of these
factors in the actual measurement, but we can gradually weaken the influence of
these factors by constantly tracking them. Increasing the sampling rate and
accuracy can help characterize the influence of these external factors.
RELATED WORK
Power measurement is difficult, but it is necessary for many types of analysis.
There is much previous work with regards to power measurement.
2.1 Estimated Power
Instead of measuring power, it is possible to estimate power usage by creating
models based on various parameters, such as performance counter data,
temperature, etc. [26, 9].
An extension of this is the Running Average Power Limit (RAPL) measurements
found in recent Intel processors [11, 24]. These are typically estimated power values
that are provided by a helper processor and can be read by the user. While useful,
we prefer to do actual power measurement. Also, RAPL readings are only available
on Intel systems, and not available on ARM based platforms.
2.2 Commercial Devices
You can buy devices that can measure power at the wall outlet, such as the
WattsUpPro? power meter [15]. These tend to be expensive (over $100) and only
have a resolution of 1Hz. Also you cannot get detailed power measurement, only
total system power.
Hackenberg et al. [19] validate RAPL power measurements in a server, but use
multi-thousand dollar calibrated voltmeters.
Desrochers et al. [12] measure detailed DRAM memory power consumption, but
use a commercial digital/analog data acquisition device which is much more
expensive that the device we propose.
2.3 Low-Cost Power Measurement
Paradis [21] looked into using Teensy boards to measure performance of
server-class workloads. Our goal is to extend this but to also measure embedded
systems.
Others have tried taking extremely small embedded devices and creating small
data acquisition devices suitable for power measurement, such as the IViny based on
the ATtiny85 [5].
Schaff and Weaver [25] investigate the accuracy of an Adafruit USB Power
Gauge with an ATtiny85 and INA169 current sensor. They find that the A/D
converter on the ATtiny85 is not as accurate as using a dedicated volt meter to
measure the results from the current sensor.
Moreno et al. [20] use the sound card of a desktop system as a low-cost A/D
converter for obtaining low-cost power measurements.
Bedard et al. [8] propose PowerMon2, a device that measures power inside of a
server system.
Ge et al. [16] instrument an entire cluster for ne-grained power measurement,
but this involved intrusive instrumentation of each machine.
Rashti et al. [23] design a PCIe card capable of measuring server power. We wish
to measure embedded systems power though.
2.4 Raspberry Pi Power Measurement
Other researchers have measured the power of Raspberry Pi systems.
Geerling [17] has done a similar experiment with the Dramble cluster. They
measure the Raspberry Pi power, and note that one must be sure to turn o the
HDMI interface and LEDs to save power. Unfortunately full experimental details
are not given.
Cloutier et al. [10] instrument a Raspberry Pi cluster and allow measurement at
a per-node level using SPI A/D converters. This is not a general purpose solution
though. They also provide power measurements of Raspberry Pis, but only for the
Linpack benchmark.
On the Raspberry Pi Forum, Eames designed a similar experiment [13].
However, the experimental process is not rigorous, and the experimenter did not
finish the whole experiment completely. Eames also measured the Raspberry Pi 2's
power [14] relatively systematically. We carry out similar experiments. This was
done because there is no comprehensive official results for how much power a
Raspberry Pi consumes.
EXPERIMENTAL SETUP
3.1 Hardware
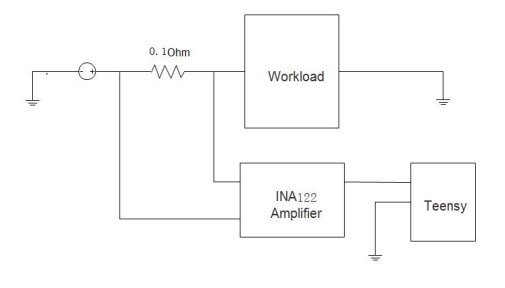
This section will talk about the hardware component of our power measurement
setup. A diagram of our test setup is shown in Figure 3.1.
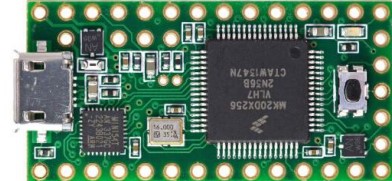
3.1.1 Teensy
The core part of our measurement device is a Teensy development board, shown
in Figure 3.2. The Teensy is used to collect data and to upload this data to the
computer for subsequent analysis. We use a Teensy model 3.1 in this work. This
model has a MK20DX256 32 bit ARM Cortex-M4 72 MHz processor, one 12-bit
resolution ADC with 18 MHz frequency and 10 easy to use analog pins [6]. The
Teensy can be operated from 3.6 to 6.0 volts. Also the Teensy has a 3.3V (100 mA
max) internal power supply. Unfortunately, the Teensy 3.1 is currently discontinued.
The lowest model currently available is Teensy 3.2, priced at $19.80. The main
difference between the Teensy 3.1 and 3.2 is that the Teensy 3.2 adds a more
powerful 3.3 volt regulator, with the ability to directly power ESP8266 Wifi,
WIZ820io Ethernet and other power-hungry 3.3V add-on boards. These features
should not affect this experiment, so it should be possible to reproduce this
experiment with Teensy 3.2 without any problems.
3.1.2 INA122 Instrumentation Amplifier
The Teensy is a low-end embedded board, so while it has an analog to digital
converter, it is not capable of measuring the small voltages required in our work. To
reduce the error, we use an instrumentation amplifier. The INA122 instrumentation
amplifier can provide gain proportional to a gain resistor RG as shown in Figure 3.3:
The voltages we are measuring are roughly from 10mV to 50mV, and the Teensy
cannot measure voltages above 3.3V, so we increase the voltage range to fall
between 1V and 2V. We chose a RG of 7.5k, made by putting a 4.2k Ohm resistor
and a 3.3k Ohm resistor in series. Their actual resistance is 4.22k Ohms and 3.25k
Ohms, so by using the formula, we get an actual gain of 5 + 200k/7.47k = 31.77.
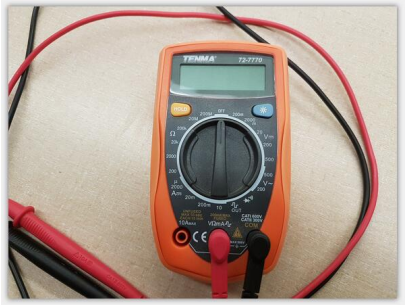
3.1.3 Voltmeter
To validate our measurements we need a reference. For this purpose we use a
model Tenma 727770 multimeter as shown in Figure 3.4. The detailed values for
the resistors in Section 3.1.2 are also measured by this multimeter.
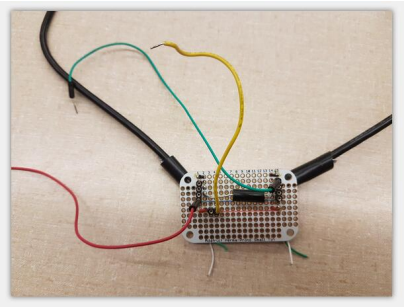
3.1.4 Self-made power supply cable
For our experiments we will be measuring the power usage of a Raspberry Pi.
To measure the power, we will need to measure the current draw across a sense
resistor. The Pi does not have such a resistor built in, so we need to add a resistor.
We built a custom cable that lets us insert a 0.1 Ohm resistor in series with the 5V
power supply entering the Pi, as shown in Figure 3.5.
3.2 Source code and Software Tool
This section describes the various programs used for measurement, as well as the
core logic code for the Teensy. Some of the software failed for a variety of reasons,
as will be discussed.
3.2.1 Operating System and Virtual Machine Setup
A virtual machine solution was used because development and experiments
alternated between Windows and Linux. The primary system was Windows, so a
Linux virtual machine was run under Oracle VirtualBox. The version of VirtualBox
used was 5.1.28. In order to share the serial port with Windows, the extended
package and VBOXADDITIONS was also installed. Linux is running Ubuntu Mate
64-bit version, the kernel version is 3.19.0-49-generic.
3.2.2 Teensyduino Environment
Teensyduino is a development environment based on Arduino, so before installing
Teensy, we have to install Arduino first. In Windows, this is straightforward, just go
to the Arduino website, download the program and install it. Then download the
Teensyduino Windows Installer and install that. My main problem with the
Windows version of Teensyduino is that Windows can not identify Teensy from the
serial port. The Windows Serial Installer is available on Teensy's website, but
sometimes it does not work. Windows can download the program to the Teensy, but
the Teensy can not return the data. Three different computers were tried, all of
them running on the Windows 7 operating system: one worked, the other two did
not. Online it was found that someone solved this problem successfully by
modifying the registry, but that did not work on either of these two computers.
On Linux, we also have to install Arduino first. When installing using apt-get,
the Teensyduino Linux Installer will not work, so we need to note that the
Teensyduino Linux Installer will only work for personal installation. Also under
Linux we have to install udev rules.
The Teensyduino version used is 1.24, the newest version at the time of writing
is 1.4 The more detailed differences between these two versions is discussed in
Section 3.2.4.
3.2.3 Linux Perf Tool
The Linux perf tool [18] is used for performance measurement. It enables
applications to take advantage of the hardware performance measurement unit
(PMU), tracepoint, and special counters in the kernel to gather performance data.
Not only does it analyze the per-thread performance of a given application, it can
also be used to analyze performance issues with the kernel. This can be used to nd
performance bottlenecks.
Typing sudo apt-get install linux-perf-4.4 in a Linux terminal will
automatically install the perf tool. To use perf, one runs perf stat [program].
This will record statistics and provide an overview and performance summary of the
program being debugged in a concise and condensed manner.
3.2.4 Main Program
This section discusses the code for the Teensy that implements our interface.
3.2.4.1 Initialization
The first part of our code does the initialization, as shown in Figure 3.6. This
sets the Teensy's ADC resolution, average value and sampling speed, conversion
speed and reference voltage. It also sets the serial transmission speed and LED
indicator. The resolution of a Teensy ADC can reach up to 16-bit, but this will
cause greater memory pressure, so here the resolution is set to 12-bit. The
conversion speed is set to high speed, which is the highest speed within specs for
resolutions less than 16 bits. For the sampling speed, the higher impedance should
reduce the sampling speed; in this experiment, the impedance is small, so we set the
sampling speed to high speed. We also set the reference voltage to 3.3 volts,
combined with 12-bit resolution, meaning that the read data is converted to the
actual voltage using the formula (3.3/4096) × data. Also note the commented out
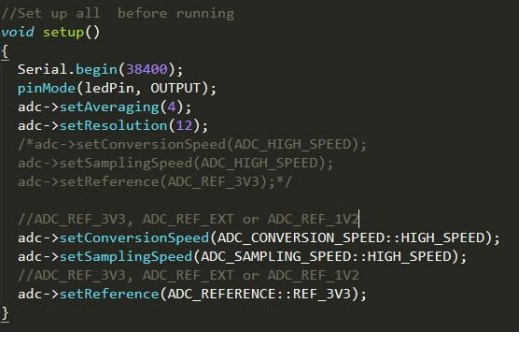 Figure 3.6: Main program initialization
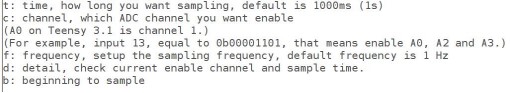
Figure 3.7: User interface
section, which is the difference between the code in this experiment at the
Teensyduino 1.24 and 1.4 versions.
3.2.4.2 User Interface
Our code provides a helpful interface, making it easier for users to use the
program. An example of the interface is shown in Figure 3.7.
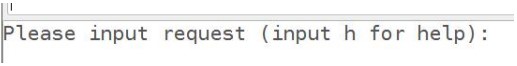
Figure 3.8: User interface help
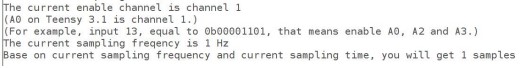
Figure 3.9: Check settings interface
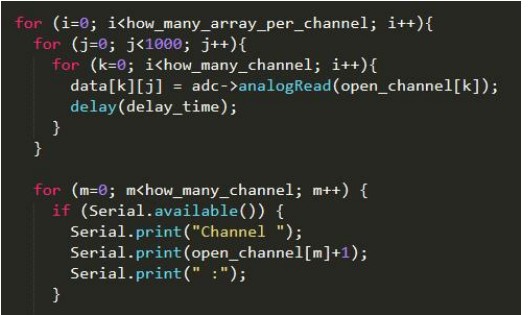
Figure 3.10: Main Logic
If the user does not know how to use this program they can enter `h' to display
the help interface, shown in Figure 3.8.
The default behavior is to open ADC channel 1, the sampling frequency is 1 Hz,
and the sampling time is 1 second. Users can change these values at any time, but
they also can type `d' to check what the existing values are. It should be noted that
after each restart the settings on the Teensy will be restored to the default values.
The “check” interface is shown in Figure 3.9.
3.2.4.3 Main Logic
This section describes the most important part of the program, the main logic,
as shown in Figure 3.10.
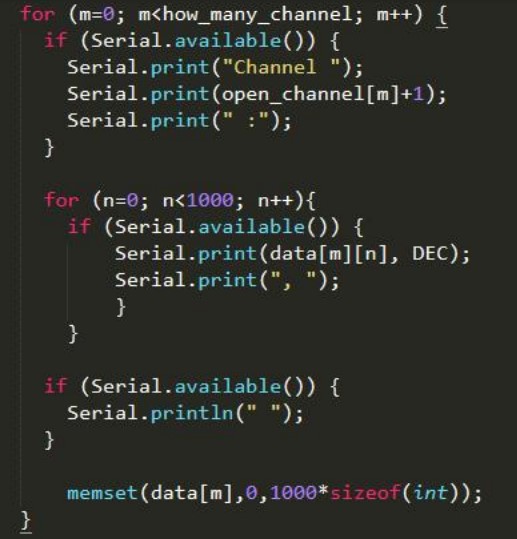
Figure 3.11: Data Transfer
This code will sequentially scan each open port, take one data element from each
port, and repeat until each port has taken over 1000 elements. It will then return
the data to the computer through the serial port. The data transfer code is shown
in Figure 3.11.
The benefit of this code is that it can loop indefinitely, no matter how long it
takes to sample and how much data it needs. The disadvantage is when the data is
returned through the serial port, data will temporarily suspend the sampling of the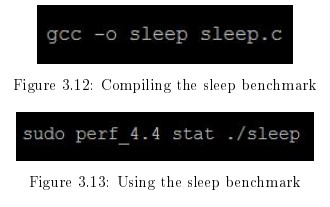
ADC. A three-minute benchmark will take about three minutes and 10 seconds, so
that sampling timeliness was affected.
Obtaining the data in one transaction was tried, but the Teensy 3.1's “each”
array can only hold roughly 3,200 data elements, and the Teensy will stop working
if it exceeds that number. A “multi-dimensional” array can bring that number to
around 14,400, but that figure was still far behind being able to support taking a
three-minute benchmark at a 1kHz sample rate. We made the trade-o of taking
1000 elements at time, while incurring some data loss. This allows the program to
run stably over a long time period.
During the sampling process, an LED indicator is lit so the user can tell whether
sampling is still underway.
3.3 Benchmarks
Various benchmarks were used to test the power measurement capabilities of the
device. Namely Sleep, Bzip2, Iozone and Linpack.
3.3.1 Sleep
This benchmark was created for this work, using the C language sleep()
function which tells the operating system to sleep (and potentially go into a
low-power energy saving mode). This was used to test the Raspberry Pi while in
low-power idle mode.
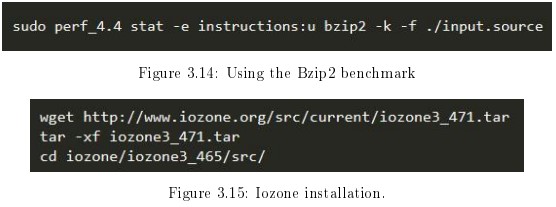
Figure 3.12 shows how to compile the sleep benchmark. Figure 3.13 shows how
to run the benchmark in the terminal while using the perf tool to monitor the
operation of the program.
3.3.2 Bzip2
Bzip2 is a lossless compression software by Julian Seward based on the
Burrows-Wheeler algorithm. It compresses better than the traditional LZ77 / LZ78
compression algorithms [3]. It is free software and is widely found in many
distributions of UNIX and Linux. It can compress normal data files by 10% to 15%,
and compression rates and decompression effciencies are high.
Figure 3.14 shows how to use the perf tool to monitor the operation of this
program.
3.3.3 Iozone
Iozone [4] is a file system benchmark tool. It can test the read and write
performance of the file system in different operating systems. It can test the
performance of hard disks in different modes such as read, write, re-read, re-write
![]()
Figure 3.16: Using the Iozone benchmark.
read backwards, read strided, fread, fwrite, random read, pread, mmap, aio_read,
aio_write.
Iozone was installed following the steps in Figure 3.15.
Figure 3.16 shows how we run iozone in our experiments. The maximum test
filesize is 16M.
3.3.4 Linpack
Linpack [22] is internationally known as a popular benchmark for testing
floating-point performance of high-Performance computer systems. It involves usingLinpack100.
Gaussian elimination to solve the first-order N-ary linear algebraic equations,
exercising the floating-point performance of the system being evaluated.
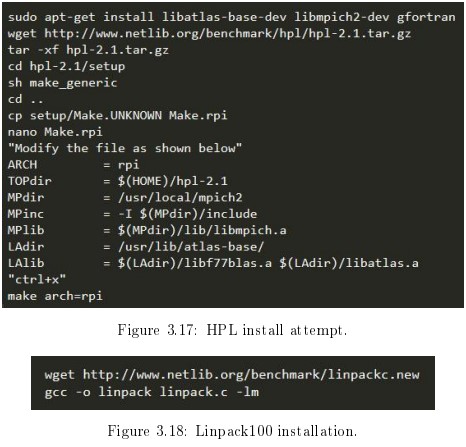
Linpack tests include three categories, Linpack100, Linpack1000 and High
Performance Linpack (HPL). HPL is used for supercomputer benchmarking and
ranking on the TOP500 list [2]. Although it is possible to run HPL on the
Raspberry Pi, I was personally unable to get it working. Details on the attempt are
shown in Figure 3.17 for reference. Instead the Linpack100 benchmark was used.
Linpack100 solves a dense linear algebraic equation of order 100, which allows
optimization with the compiler optimizations only, with no changes to the code.
The installation method is shown in Figure 3.18.
RESULTS AND DISCUSSION
This chapter contains the experimental results and analysis of the differences
between the expected values and the experimental results. Static (system idle) and
dynamic (system active) benchmarks are compared as well as results between a
Raspberry Pi 2 and Raspberry Pi B.
4.1 Results
In this section the experimental results are shown in two categories: static and
dynamic.
Static refers to the Raspberry Pi in idle mode. With the system idle, external
devices such as keyboards, monitors, and network cables were gradually added, with
the increase in power consumption noted. Since the system is idle, the voltage
measured is relatively stable. We confirmed the data accuracy of the static data by
comparing against voltmeter readings. It should be noted that the voltage of static
data is only relatively stable, it still fluctuates, especially after connecting a network
cable.
Dynamic data refers to the operation while running benchmarks. Under this
kind of load the voltage has large fluctuations, making it harder to validate against
the voltage meter readings. We tried to use the perf tool for data reference, but
unfortunately the Raspberry Pi does not have a built-in power meter that can be
read using this interface.
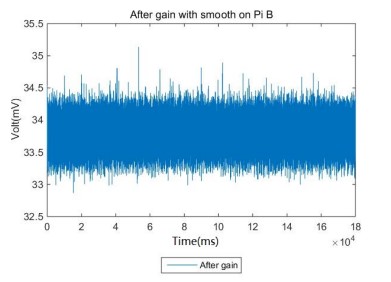
Figure 4.1: Raspberry Pi B Idle. The Y axis ranges from 1.625W to 1.775W
4.1.1 Raspberry Pi Power Measurement
The amplified
measurement is 1.121mV, with a maximum of 35.3mV across the sense resistor
(equal to a power of 1.765W).
4.1.2 External Devices
In this section, we show the data obtained after the Raspberry Pi is connected to
external devices. The purpose of this is to test whether the Teensy can measure the
increased power consumption of these external devices. The data are: keyboard +
Raspberry Pi, keyboard + display + Raspberry Pi, and Ethernet + Raspberry Pi.
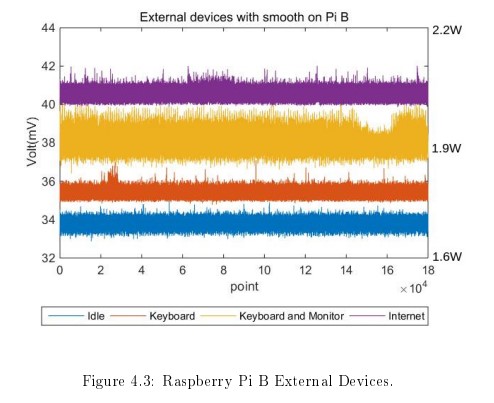
The above data sampling is performed on Raspberry Pi 2 and Raspberry Pi
respectively, and a total of six groups of data are obtained,which are shown in
Figure 4.2 and Figure 4.3.
First of all, in Figure 4.2, one can clearly see that the voltage increases with the
addition of external devices. There is one problem to be aware of, that some of the
readings were significantly higher during the second half of the test. I suspect that
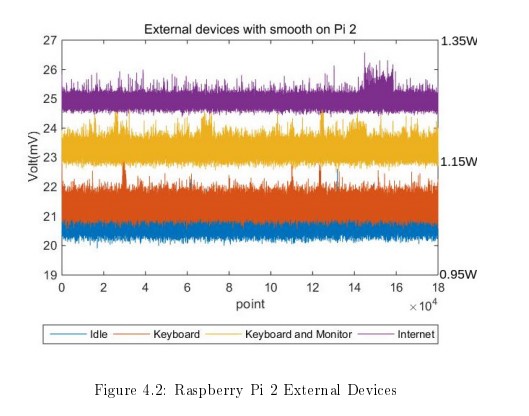
the Raspberry Pi 2 exchanged data over Ethernet in this short period of time,
resulting in a brief rise in energy consumption. We found that the power
consumption of Ethernet was significantly higher than that of the keyboard +
display.
Figure 4.3 shows the Raspberry Pi B data. We cannot explain why for the
second half of the keyboard + monitor measurements the results were lower than at
other times.
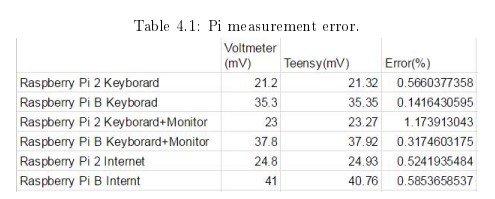
Comparison of results between the Teensy and voltmeter are shown in Table 4.1.
The error in Table 4.1 is relatively small, which should indicate that the Teensy will
be relatively accurate when it comes to measuring higher voltage data.
4.2 Benchmark Results
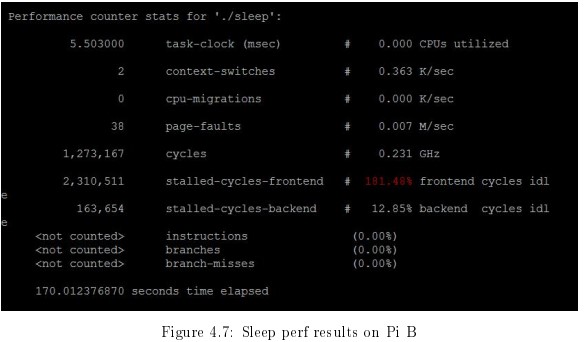
4.2.1 Sleep
The sleep benchmark runs the C sleep() function for 170 seconds. This
benchmark puts the Pi into idle mode, although some daemons and other system
activity may still be running in the background and this can cause fluctuations.
Figure 4.4 shows the power results, and Figure 4.6 shows the perf results.
One thing to note in Figure 4.6, we can see that this benchmark ran for 170
seconds. In Figure 4.4 the area with relatively large noise lasted for less than 140
seconds at a sampling frequency of 1000 Hz. The Sleep equation ran for less than
140 seconds and Perf showed that the program ran for 170 seconds and it is unclear
why. find the possible explanation.
The Teensy data and perf tool data for Raspberry Pi B are shown in Figures 4.5
and 4.7. We can see a similar result to the Pi2 results. The difference is that there
are more outliers in the sleep area. This may indicate that the Raspberry Pi was
running other programs simultaneously while executing the sleep() function.
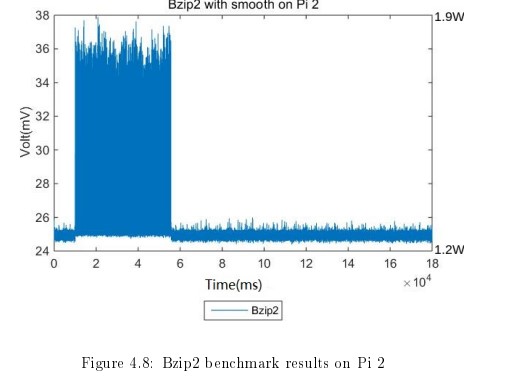
4.2.2 Bzip2 Results
Bzip2 is a compression benchmark included as part of the SPEC CPU2006
Benchmark suite [27]. SPEC's version of Bzip2 performs no le I/O other than
reading the input. All compression and decompression happens entirely in memory.
This is to help isolate the work done to only the CPU and memory subsystem. The
results of the Raspberry Pi 2 Teensy data and Perf tools are shown in Figures 4.8
and 4.10.
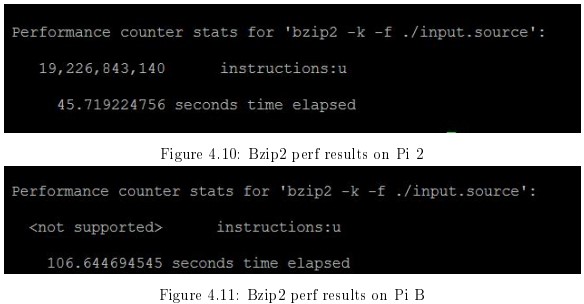
In Figure 4.8 we can see an area of significantly higher reading than the rest. In
the Perf tool, it shows that the Bzip2 benchmark ran for 45.7 seconds. and we see
the region did continue for roughly the same amount of time, indicating that Teensy
did observe the Bzip2 benchmark. However, in this region, the readings are very
messy and dense, and we can not determine the accuracy of these readings.
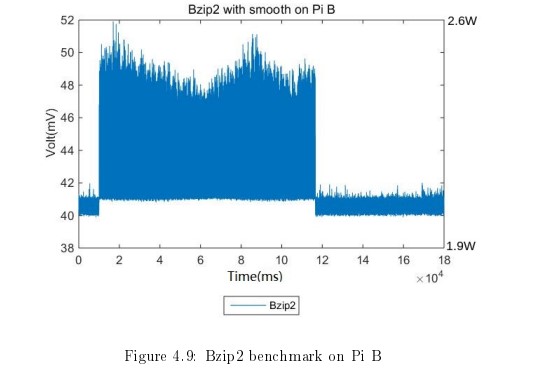
Figure 4.9 shows the Teensy results on Raspberry Pi B. Not only do these
figures clearly show the approximate time of the Bzip2 benchmark, but there are
also significant fluctuations in the curve. The perf results in Figure 4.11 are
incomplete because the ARM1176 chip in the PiB is not capable of splitting out
user and kernel mode events separately.
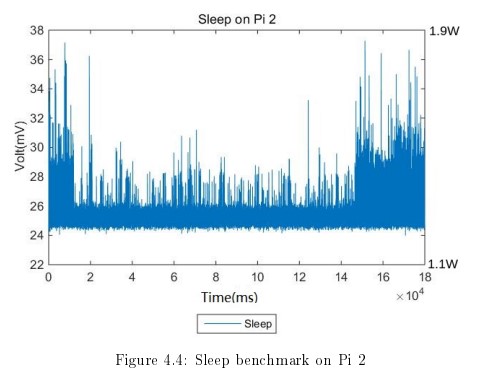
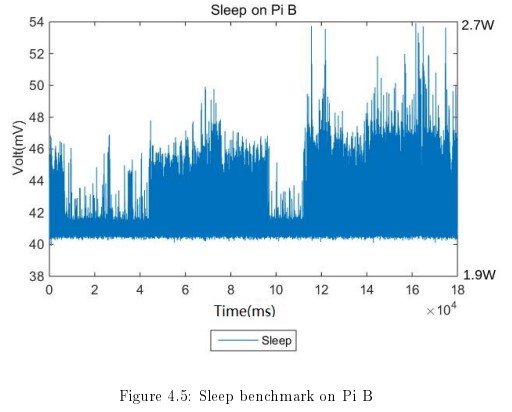
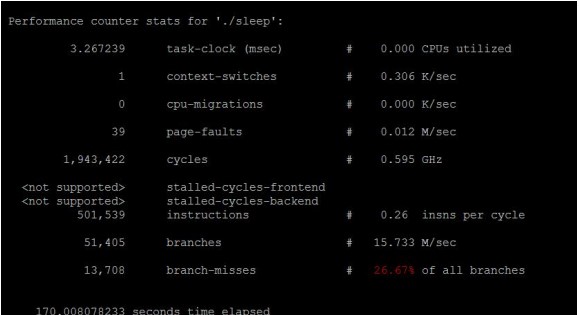
Figure 4.6: Sleep perf results on Pi 2
By comparing the Pi2 and PiB results, we can conclude that Teensy can indeed
observe dynamic data. However, because of noise, we can not tell if the Teensy's
reading is correct when the data changes rapidly.
4.2.3 Iozone Results
Iozone is a benchmark for stress testing file I/O. Figures 4.12 and 4.13 show
Teensy data for Raspberry Pi 2 and Raspberry Pi B. Figures 4.14 and 4.15 are the
results of the Perf tool.
This data shows disk I/O (SD card in the case of the Raspberry Pi) and should
not be stressing the CPU or memory much.
4.2.4 Linpack100 Results
Linpack is a benchmark for testing floating-point performance of
high-performance computer systems. Figures 4.16 and 4.17 show the results on Pi2
and PiB. The perf results are shown in Figures 4.18 and 4.19.
The use of floating point makes the power usage rise rapidly. The smaller
fluctuations as the program progresses are hard to make out.
4.3 Power and Energy
In this section we will show the energy and power used by Raspberry Pi 2 and
Raspberry Pi B for the benchmarks. It should be noted that for static data, the
value is relatively stable, so the results will be more accurate. However, dynamic
data has more variation and it can be harder to find the benchmark start and stop
points.
Table 4.2 shows the data from idle mode. The result we should see is Raspberry
Pi B power and energy consumption is much higher than Raspberry Pi 2. This is
likely due to the more advanced power regulation circuitry introduced starting with
the Pi B+ model. For comparison, Eames [14] reports Pi 2 current in Idle mode is
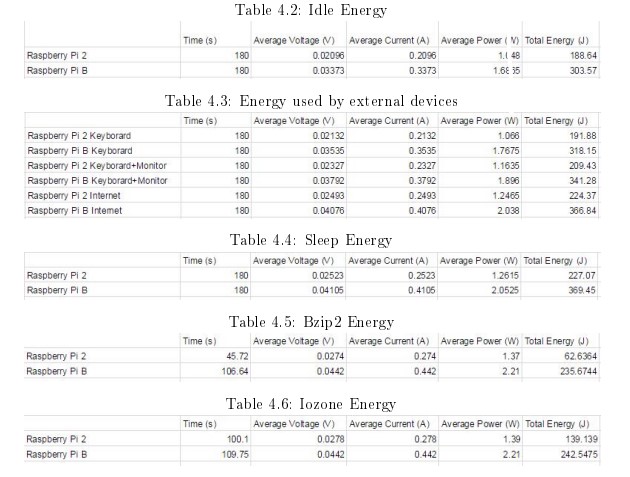
0.230A while that of Pi B current is 0.360A. Our data is 0.2096A and 0.3373A,
respectively which is very close to the figures given.
Next is the data for the external devices, shown in Table 4.3. With the
Raspberry Pi 2, the keyboard power is 0.018W, HDMI interface power is 0.081W,
and Ethernet power is 0.1985W. On Raspberry Pi B, the power of the keyboard is
0.081W, the power of the HDMI interface is 0.1285W, and the power of the
Ethernet is 0.3515W. It can be seen that Raspberry Pi 2 has a significantly lower
power consumption in all aspects than Raspberry Pi B.
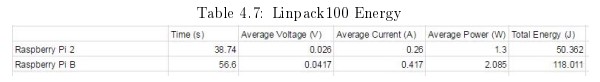
Tables 4.4, 4.5, 4.6 and 4.7 show the power and energy consumption data for the
four benchmarks Sleep, Bzip2, Iozone, and Linpack.
Because it is not possible to determine the end time of the Sleep benchmark, the
average power and total energy consumption can only be calculated using a total
length of 180 seconds, and it is possible to consume less energy during Sleep
benchmarks than in Idle mode.
Among the four benchmarks above, Iozone has the highest energy consumption
and Linpack has the lowest energy consumption. This is primarily due to
Linpack100 having a short runtime.
CONCLUSION AND FUTURE WORK
5.1 Conclusion
This experiment had various goals, most of which were achieved.
The first and primary goal was designing a low-cost power measurement board.
The equipment for the entire experiment, including Teensy, amplifiers and resistors,
cost no more than $30. The two most expensive parts were a Teensy 3.1 and
INA122 amplifier that cost $19.80 and $6.32, respectively.
The second goal was stability and long-term stability of the measurement board.
We achieved this, with the device still working properly after reading Raspberry Pi
data in idle mode for up to 1 day at a sampling frequency of 1kHz.
The third goal was high sampling resolution. The 12-bit resolution of the ADC
was sufficient for most situations, but it does limit measurement accuracy especially
at low voltages. There also appears to be noise in in the output, and it is unclear
whether this is due to actual changes in power or if it is inherent in our
measurement setup. Although the noise can be eliminated by post-processing, this
may affect the accuracy of our measurements.
An additional goal was the ability to upload the data efficiently to another
machine. The Teensy is severely memory constrained, thus it must regularly upload
data to another computer. The transfer of data over the serial port is slow relative
to the sampling speed. This means that every time we upload data to a computer,
we lose a portion of the data. Even though there is not a lot of data in this section,
it is a blow to the timeliness, completeness, and overall accuracy of the data.
Another goal was high sampling speeds. We manage 1kHz, which is many orders
of magnitude faster than the 1Hz provided by some devices. However, the speed ofmodern computer CPUs is in the GHz range, so when we test these computers we
potentially lose a lot of detail. Efforts were made to raise the sampling frequency,
but the cost of increasing the sampling frequency was a dramatic drop in stability.
This is mostly a problem with our data-capture program, but there may be
limitations inherent in the Teensy architecture as well.
A final goal was ease of use. After downloading the program to the Teensy, the
user only needs to install the serial port driver and a serial port testing program to
use it easily. Drivers can be downloaded from the offi website of Teensy and the
serial port testing program can be easily found on Google. The user interface text is
human readable. The more difficult-to-understand parts have clarifying notes and
examples available so that users can easily use it on the first try.
5.2 Future Work
There are several future items potentially worth doing.
The Teensy 3.1 used in this experiment has been discontinued, and the new
Teensy models provide performance improvements. It would be good to try out
these new models of Teensy.
There is a lack of trustworthy comparative data available for this experiment.
We would like to test a number of additional competing devices that can provide
similar power measurements, and analyze the differences in results gathered from
these devices.