
Set up a Raspberry Pi to graph and monitor air quality with InfluxDB and Grafana.
Have you ever been interested in monitoring the air quality in your home or outside where you live and work? This project, which we’ve dubbed balenaSense, will get you up and running with a setup to take readings of temperature, humidity, barometric pressure, and air quality, and provide a dashboard that you can access from anywhere to see the stats at a glance and monitor trends.
Introduction
Building an air quality & weather station used to involve a lot of wiring and different sensors, but with the advent of sensors that combine all the readings into one component on a nice little breakout board, it’s easy to get started.
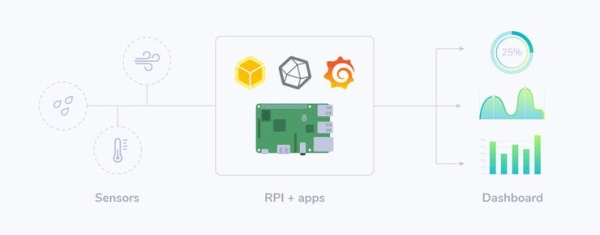
We’re going to look at monitoring temperature, humidity, barometric pressure and air quality using an all-in-one sensor that connects directly to a Raspberry Pi with no additional components required. You don’t need any experience in electronics but a soldering iron would be handy (although not required). This project implements a database to store historic readings along with a graphical interface to see current readings and trends at a glance.
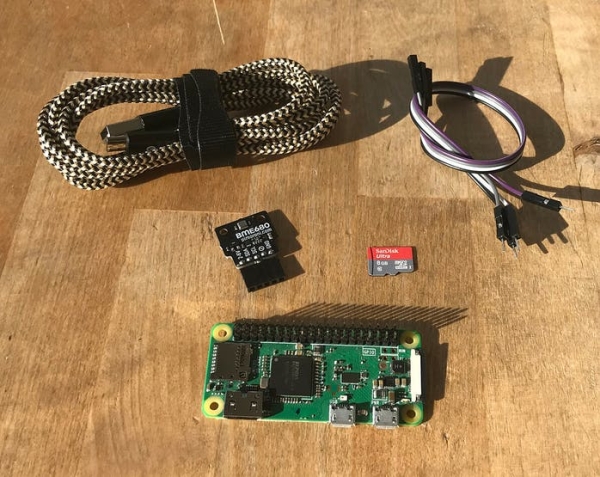
Hardware required
Here’s the shopping list for this project. Depending if you’d like to crack out the soldering iron or not will dictate what sensor board you can use; some are plug and play, some require a little soldering.
I don't want to solder
If you don't want to solder (although this is a good project to give it a try!), you'll need:
- Raspberry Pi Zero WH (also works with 2Bv1.2/3B/3B+/3A+)
- 8GB (or larger) Micro-SD Card (we recommend Sandisk Extreme Pro SD cards)
- Power supply & cable
- Pimoroni BME680 sensor with breakout board
- Pimoroni breakout garden pHAT
I want to solder – let me at it!
If you're happy doing a little soldering, you'll need:
- Raspberry Pi Zero W (also works with 2Bv1.2/3B/3B+/3A+)
- 8GB (or larger) Micro-SD Card (we recommend Sandisk Extreme Pro SD cards)
- Power supply & cable
- Bosch BME680 sensor with breakout board (see alternatives below)
- Connection wire
Other sensors
If you already have one, this project also supports the use of the Sense HAT, with the added bonus that you'll get a smiley face showing on the LED matrix (depending on the air quality, of course)! Note: the Sense HAT doesn't include a gas sensor and the readings are quite inaccurate as they are heavily affected by their proximity to the Raspberry Pi CPU. If you are starting from scratch don't buy a Sense HAT for this project; get one of the BME680 options instead!
You can get hold of the Bosch BME680 sensor on a breakout board from a variety of vendors too, all at varying costs.
- Pimoroni BME680 breakout £18.50 (can be solder-free with their pHAT)
- Adafruit BME680 breakout US$22.50
- Sparkfun SparkX BME680 US$19.95 (can be solder-free with their HAT)
- Unbranded BME680 breakout US$9.92
Note: The Pimoroni breakout board is the one we’ve used in this article; this board has the added benefit that the pins are broken out in the correct order to just plug straight into the Raspberry Pi GPIO header. When using other boards you’ll need to be careful to ensure the pins for power, ground and the I2C bus (SDA and SCL) are matched – this is explained further on in the guide.
Software required
We’ve set up the balena-sense project on GitHub which contains all of the software, configuration and code you’ll need to start taking readings straight away. We’re going to deploy this project on balenaCloudusing a free account to push the project and all the software to your Raspberry Pi as well as to provide remote access. Therefore, you’ll need:
- Tool to flash your SD card, such as balenaEtcher
- A free balenaCloud account
- A clone or download of our project from GitHub
1. Putting the hardware together
You’ve got very little to do on the hardware front for this project; our goal here is to connect the sensor board you purchased to the Raspberry Pi general purpose input/output (GPIO) header.
The BME680 sensor communicates with the Raspberry Pi over a bus called I2C (eye-squared-see), which is a serial communication bus that requires 2 wires. These two communication wires are referred to as serial clock (SCK) and serial data (SDA). In addition to the two communication wires, we also need to provide the sensor with power (3.3V, or 3V3) and ground.
If you went for the solder-free option from Pimoroni or Sparkfun, or are using the Sense HAT, you’ll just have to plug your shiny new components together along with your Raspberry Pi, and all of the connections will be made for you – go forth, to the next step!
If you decided to connect a sensor directly to your Raspberry Pi, either the Pimoroni one or any one of the other breakout boards from one of the other suppliers, the main things to watch out for are that the pins described above (SDA, SCK, 3V3 and GND) are correctly connected.