
Turn a Raspberry Pi into a home energy monitor with inexpensive components.
Update 2018-04-21: Published code for the web application. This is functional but not as polished as I'd like it.
Update 2018-04-13: The system is installed in my breaker box and collecting live data. So far, so good.
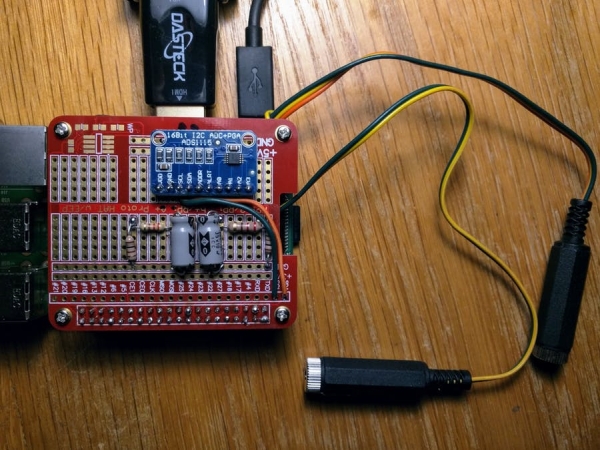
Update 2018-03-26: The hardware is working. I'm updating the main photo. I repeated the installation on a fresh Pi and made a few minor changes to the Python code in BitBucket.org. Pull new code to get the fixes.
Update 2018-03-25 : The hardware for my permanent installation arrived. I've got the Pi hat board made up (but not tested or documented, yet).
I've received several comments and lots of “respect” that is a bit of a surprise and much appreciated.
Two of these comments may be included in future versions:
- Add support for JavaScript Web Tokens compatible with Google IOT (or similar) cloud services.
- Change the simple Analog-to-Digital converter I'm using now to a more feature-rich energy metering IC such as the Atmel M90E26.
Background
This project got it's start because my local electric utility has started offering time of day rates. If you sign up, you get cheaper rates overnight and pay more during peak hours.
The problem is I have no idea how much power I use by the time of day. I don't have a smart meter and the power company only offers power consumption history on a monthly basis.
There are expensive commercial solutions out there but I thought, maybe I can build my own using a Raspberry Pi I had laying around.
There are several similar projects on Hackster.io. Most are Arduino-based but there are a couple of Raspberry-pi based:
- https://www.hackster.io/samuelphy/energy-meter-logger-6a346
- https://www.hackster.io/ControlEverything/energy-monitoring-through-a-raspberry-pi-190a2a
Requirements
Here are the requirements I set out for the project:
- Measure household electrical energy (in amps and kilowatts) at least once per minute.
- Measure the current passively. That is, I don't want to have to disconnect any wiring to hook my system up.
- Open source hardware and software.
- Show the most recent power reading on a gauge
- Show power as a function over the last 24 hours
- Show power averaged by the hour of the day
- Show power used in time buckets that correspond to my utility's TOD usage plan.
- Be visible on my phone or a browser from anywhere
- The web application should be secure (use SSL, hash passwords, secure login tokens, etc).
- The web application should be small enough to run on the free tier of the popular cloud service providers.
- Be expandable to measure other things in the future
Safety
This project means connecting things inside the power panel in your home. It almost goes without saying: Working with electricity improperly can result seriously injury or death.
The decision to be safe is yours and yours alone. If you are not sure you have the skills and experience to do this, a licensed electrician would be a great idea.
Skills Needed
- A basic working knowledge of AC/DC circuits.
- How to use a breadboard and, if you decide to commit this to a soldered prototype board, how to solder.
- How to use a digital multi-meter.
- Basic Raspberry Pi skills (including the ability to install software).
Not Liable
Although I've made my best effort to do a good job, I cannot rule out or accept responsibility for any errors or omissions that might exist in this project.
By using this project, you agree to accept all liability.
Circuit
The circuit in the schematic below has three parts
- L1 is an inductive current sensor. At 100 amps, it produces a current of 50 milli-amps. The sensor is inductive which means you just clip it over the conductor. It isn't directly connected. It senses the magnetic field that surrounds the connector.
- The circuit converts this current to something less than 5 volts, which the ADC can read.
- An analog-to-digital converter that reads the voltage, converts it to digital values that the Pi can read.
R1 is a 100 ohm resistor which is placed across the inductive sensor. This so-called burden resistor converts current to voltage. The value is set using ohm's law. At 100 amps, the sensor produces 50 milliamps. The 100 ohm resistor turns this into 5 volts, which is the maximum voltage the ADC can read.
The R2 and C1 form a low-pass filter, which reduces high frequency noise that can interfere with accurate measurements. The cutoff frequency is about 70 hz.
The filtered, reduced AC voltage is fed into the analog input of the ADC 1115.
The ADC is controlled by the Python code running on the Pi, which is described below.
Most houses in the US have two phases or legs. To measure all the current flowing into the house, we need to measure both legs and that means two of these circuits. Fortunately, the ADC 1115 has 4 analog inputs. To handle this all you need do is repeat this circuit and plug it into the second analog input.
Installation
To install, you'll need to install the two sensors over the main feeds to your breakers. There's high voltage nearby, so this should only be done by those with the necessary experience. In some areas, you may need to be licensed. If you aren't qualified to to do this, a licensed electrician will make short work of it.
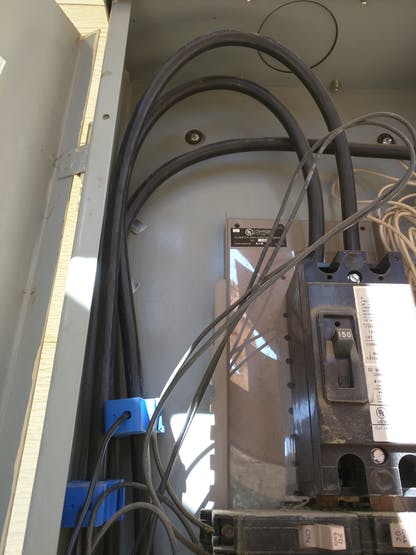
In my installation, the sensor leads feed into the house, where they're plugged into the Pi.
Sampler.py
The sampler Python code is designed to be placed in a cron entry. It takes one sample and exits. On my Pi, the sampler runs every minute.
The circuit produces an AC voltage ranging from -5 to 5 volts. The sampler reads these values at 860 times per second, calculates an RMS value and stores that in the SQLite3 table.
You might be wondering: Why sample AC voltage when you can convert AC to DC using diodes?
It's good question. The problem is that most diodes need a few tenths of a volt to activate. It's surprisingly hard to rectify low voltages.
Transmitter.py
The transmitter Python script is also designed to be run from cron. It reads up to 20 entries from the table, transmits them to a web destination and then deletes them.
The web application can be anything that accepts an HTTP post with JSON like this:
{ 'readingdate' : 2018-03-01T13:14:00, 'current1' : 0.0, 'current2' : 0.0}
I'm working on a web application that does this and produces graphs and gauges of results.
Installing Software
Log into your Pi as the pi user.
Use git to clone a repository of the software at BitBucket.org.
git clone https://bitbucket.org/mnigbor/homeenergy-pi.git
You will also need to install the Adafruit ADS1x15 Python library and it's dependencies. Follow the installation instructions on their github page.
The ADS1x15 module depends on Adafruit_Python_GPIO and Adafruit_Python_PureIO. Install these from their respective github pages.
The sampler should work without any configuration changes (but let me know if you find something that can be improved).
If you decide to use the transmitter, you will need to configure the software, edit the HomeEnergy.json file (using nano or any other text editor).
{
 "Database": "/home/pi/homeenergy-pi/HomeEnergy.db",
 "Sampler":
  {
 "A0":
    {
 "A": 0.0000,
 "B": 0.002229,
 "C": 0.000000,
 "gain": 1
    },
 "A1":
    {
 "A": 0.000,
 "B": 0.002677,
 "C": 0.000000,
 "gain": 1
    }
  },
 "Transmitter":
  {
 "loginURL": "DESTINATION URL HERE",
 "currentURL": "DESTINATION URL HERE",
 "userName": "USERNAME HERE",
 "password": "PASSWORD HERE"
  }
}
The file has three top-level sections:
- Database
- Sampler
- Transmitter
The Database section has one entry, which is the path to the SQLite3 database file. Unless you move your installation to another location, you shouldn't have to change this.
The Sampler section has two subsections: A0 and A1. These are the two ADC channels used in the circuit. Each has the same structure:
- A: Zero offset
- B: Slope or first order regression
- C: Second order regression
- gain: The gain setting for the ADC
A, B, and C are used to convert the digital values from the ADC into amperage. These were set during calibration. If you use the same sensors I did, these values are probably close. If you use different sensors, you'll need to do your own calibration.
The Transmitter section has the following entries:
- loginURL: The URL where the program obtains a login token
- currentURL: The URL where the program sends current data
- userName: The user name used to obtain the login token
- password: The password used to obtain a login token
Use the directions on this link to configure cron to run the sampler.
Source: HomeEnergy – Pi