
Purpose of Project
As a pilot and the author of the software used at www.livesectional.com I've built a number of Live Sectional Metar Maps of various sizes. The hardest part of building those maps is the positioning of the string of RGB LED's in position. The more airports used the longer the project took. This project is my answer to building a Live Sectional Metar Map with a high density of airports displayed in an efficient manner. This also had the added benefit of being much cheaper to build given the number of airports its capable of displaying.
Summary of Project
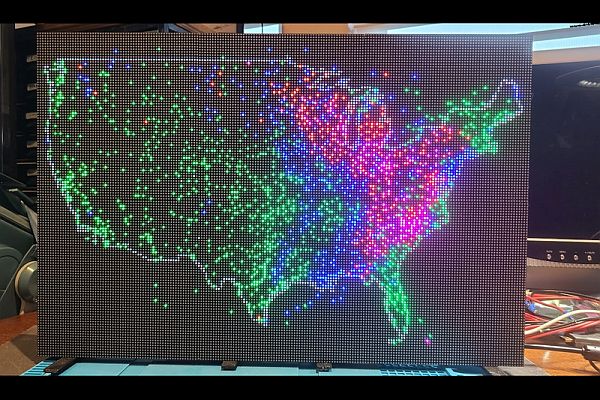
Using LED Matrix panels as building blocks, this project creates live Metar Maps with weather shown by airport. This allows for an extremely high number of airports that can be displayed, as many as 3000+ for the US alone!
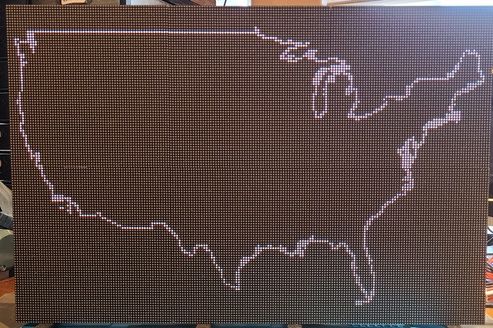
Using the Lat/Lon coordinates published by the governement, the project can display the outline of every state, the lower 48, the lower 48 plus Alaska and Hawaii. It also has the ability to display all the airports within a custom area such as a sectional map or even countries outside of the US as long at the FAA provides a METAR for the airport.
The METAR data is received using the API that the FAA provides at www.aviationweather.gov. The software was written to collect the weather data for as many airports as desired in 300 airport groups. And because of the nature of the LED Matrix design, there are many LED's available to display the METAR flight category color.
There is a web based admin page that allows for easy control of the display. The software can also be displayed from the command prompt by passing variables on the command line. Lastly, there is a group of default values stored in the main script that will be used if no command line arguments are passed to it.
This software uses the awesome library ‘LED-matrix'; https://github.com/hzeller/rpi-rgb-led-matrix by Henner Zeller. This allows for many LED Matrix' to be connected to create larger displays. This software has been written to scale to the appropriate size once the necessary constants are set properly.
As you can see from the pictures, I've built small desktop displays using 64×32 matrix, 64×64 matrix all the way up to 192×128 matrix.
Note: because the LED Matrix uniformally position the LED's in a grid, the smaller the Matrix used, the less accurate the location of the airport will be due to the lower resolution. However, when multiple Matrix are chained together, the resolution goes up making this issue less noticeable.
Design Considerations
Because of the flexibility inherently built into the project there are many ways in which to use the Display. Below is a short list of possibilities.
- In its simplest form a single State (or region) can be displayed and updated periodically. This setup works great if the builder would like to overlay a map of the region and let the color bleed through or the builder can punch holes at each airport. This would exactly mimic the design of a Live Sectional Map as demonstrated www.livesectional.com.
- The software is written to allow a list of states to be cycled through 1 at a time. This is nice as it will show the weather in various locations over time. The continental 48 state outline and weather can be cycled in and out of rotation as well. There are regional lists available as well that will cycle through the Southwest region, Midwest region etc.
- A custom region can be created as well. For instance if the region defined by a specific sectional map or an area outside the US is desired, the coordinates and airports can be stored and displayed. The steps for this is explained below.
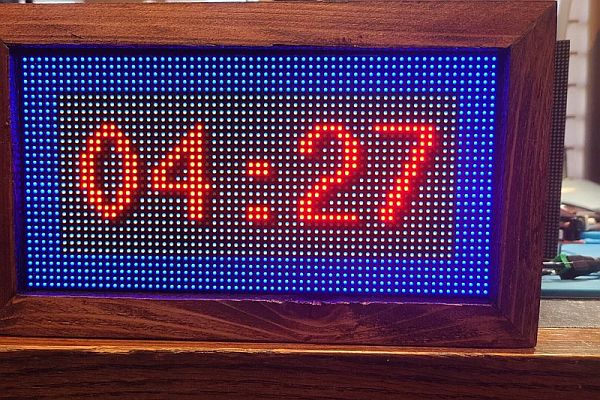
- A single small display such as a 64×32 or 64×64 can be utilized as a desktop display, or many Matrix can be connected to create a larger display and framed.
Supplies
- Raspberry Pi – Zero W works but is slow. 3B, Zero 2 and 4B's all work quite well.
- RGB LED Matrix Panel Drive Board – https://www.electrodragon.com/product/rgb-matrix-panel-drive-board-raspberry-pi/
- LED Matrix – 64×64 available here; https://www.aliexpress.us/item/2251832840839037.html or 64×32 here; https://www.aliexpress.us/item/2251832843447525.html. NOTE: I like the P2.5 (how closely the pixels are spaced together) but there are others that space the LED's out further (or closer) depending on how far away the person who is viewing the display will be.
- 5V Power Supply 5 Volt 10A 50W – https://www.amazon.com/gp/product/B07Q26YG61/ref=ppx_yo_dt_b_asin_title_o03_s00?ie=UTF8&th=1. Add the current draw's for all the displays plus the RPi and be sure to use a power supply capable of providing the proper wattage.
- Brackets to connect all the display Matrix together if multiple units are to be used. See the attached STL files for 3D printable brackets, stands and RPi Mounts.
- M3 screws and washers to mount multiple matrix' together to create larger displays.
- Framing materials if desired for finished look.
Step 1: Build Display
The number of Matrix' used will dictate how everything is wired. We'll start by describing the use of only 1 Matrix, then explain the difference when multiple Matrix' are used.
One Matrix Display
For this example we'll assume the use of a 64×32 Matrix display. Marry the RGB LED Matrix Panel Drive Board to the RPi. It simply connects on the header. The board as it comes from the supplier is ready to go if a 64×32 Matrix is used. However, a small modification to the board is required when a 64×64 Matrix is used. This modification will be explained further down after we discuss the use of multiple Matrix displays. So if you are using a single 64×64 Matrix you will need to read this part and affect this change to the Driver Board.
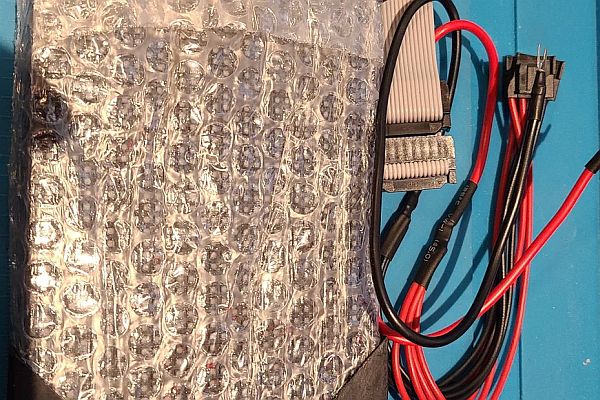
The Matrix will come with a power cable/connector that can support 2 displays. You will need to use only one of the two. Connect it to the back of the board. Double check the polarity of the connector to the board. (Red wire to +, Black to -).
It will also come with a ribbon cable. Connect this to the ‘IN' side of the Matrix and the other end to the ‘P1' connector of the Driver Board.
At this point the only thing to do is to connect to power. You can connect the Matrix power separately from the RPi and use the RPi's power supply to run everything, but this would require 2 outlet connections. Another way to get power to the RPi is to solder power and ground to the +5v and ground terminals on the Driver Board. I soldered header pins here so I could use jumper wires to provide power and ground. This will power the RPi and the Driver Board from the same power supply that is running the LED Matrix. NOTE: This worked great for all the different versions of RPi, but I noticed the RPi 4B struggled a bit with this and caused changes in the LED intensities. Your mileage may vary.
Multiple Matrix' Displays
There are alot of options on how to connect multiple Matrix' together. I'll offer 2 examples which should provide the necessary information to connect most any combination of Matrix Displays.
The first example will connect two 64×64 Matrix so that the total pixel size is 128×64.
These 2 displays will be ‘Chained' together so that the RPi and Driver Board will connect to the first (left-most if facing front of displays) via the ribbon cable connected from the ‘P1' connecter of the Driver Board to the ‘IN' of the first Matrix. Then connect another ribbon cable from the ‘OUT' of the left-most Matrix to the ‘IN' of the 2nd Matrix. As mentioned, this is known as ‘chaining' and will be addressed when we configure the software.
The 2 Matrix displays need to be mounted side by side so that the LED's are properly aligned. There are numerous ways in which to do this. There are STL files attached above that can be 3D printed which will allow them to be bracketed together using M3 screws and washers. There are also STL files that can be printed that provide legs so that the unit can stand on its own, or it can be framed and hung on a wall if preferred.
The second example will connect six 64×64 Matrix so that the total pixel size is 192×128.
In this example there will be 2 rows with 3 columns of 64×64 Matrix displays. This will require we use the 2nd connector on the Driver Board. It's labeled ‘P2'. So the first connector, ‘P1' will chain 3 Matrix displays together, using the ribbon cables from the ‘OUT' of the previous Matrix to the ‘IN' of the next Matrix.
The next row of matrix' will be ‘Paralleled' to the first row. This will also need to be addressed when configuring the software. Use the STL files attached to 3D print the necessary brackets to hold all the Matrix' together. There are 2 types of brackets, one that connects 2 display's and the other connects 4 displays. For this configuration you would need to print two of the 4-display brackets and six of the 2-display brackets. Of course there are other ways to secure them, but this is an effective way.
Modifying the LED Matrix Panel Driver Board for 64×64 displays
As mentioned, whenever a 64×64 Matrix display is used the driver board needs to be configured to handle the size of the display. Briefly, most displays use data lines labeled ‘A','B','C', and ‘D'. However, when the larger 64×64 display is used, it must have a fifth data line, labeled ‘E'. The Driver Board used with this project comes setup with lines ‘A'-‘D' but you have to solder a few jumpers to setup data line ‘E'.
In the corner of the Driver Board, next to the ‘P1' connector will be 6 solderable terminal holes (See pic of the two Driver Boards side by side to see the difference). Typically, a jumper needs to be soldered from the ‘P4' hole to the ‘GRD' hole and another jumper soldered from the ‘P8' hole to the ‘E' hole. This will provide the ‘E' data line we need. If you would like more flexibility then solder 6 header pins to these holes and use jumpers to connect the proper terminals together. NOTE: There is good informaiton down in the ‘Trouble Shooting' section here and is worth the read; https://github.com/hzeller/rpi-rgb-led-matrix
RPi Mounting
There are a few STL files that allow mounting the RPi in various configurations. So use the one that best suites your needs.
Step 2: Install Software to SD Card
Write Raspian Lite to SD Card
The information provided on github.com/hzeller/rpi-rgb-led-matrix strongly suggests the use of a minimal unix distro. It suggests either DietPi or Raspian Lite. This project uses Raspian Lite.
Start by installing Raspian Lite to your SD Card. Here's the link to download it; https://downloads.raspberrypi.org/raspbian_lite_latest. Use Balena Etcher to write the Raspian Lite image to your SD Card. Another option is to use the Raspberry Pi OS installer.
Install the newly written SD Card in the RPi and power it up with a monitor and keyboard connected. Once it boots to the command line move to the next step.
Setup Wireless Credentials and SSH
Enter the following. For more info check out; https://linuxhint.com/setup-wifi-raspberry-pi/sudo raspi-config
- Select ‘System Options'
- Select ‘Wireless LAN' and enter SSID and Password of your WiFi network
- From main menu select ‘Interface Options' then enable ‘SSH'
- Reboot when prompted. Once it reboots back to the command line move on to the next step.
Install RGBMatrix Library
To install; (Taken from https://howchoo.com/pi/raspberry-pi-led-matrix-panel)
sudo apt-get update && sudo apt-get install -y git python3-dev python3-pillow
git clone https://github.com/hzeller/rpi-rgb-led-matrix.git
cd rpi-rgb-led-matrix
make build-python PYTHON=$(which python3)
sudo make install-python PYTHON=$(which python3)
Install Other Libraries
sudo apt-get install python3-setuptools
sudo apt install python3-pil
apt install python3-flask
sudo apt-get install git
Clone Latest Version from GitHub
sudo git clone https://github.com/markyharris/ledmap.git
cd ledmap
Turn Off Background Processes
The troubleshooting section at the bottom of github.com/hzeller/rpi-rgb-led-matrix strongly suggests that some unneeded background processes be turned off. So enter the following;
sudo apt-get remove bluez bluez-firmware pi-bluetooth triggerhappy pigpio
cd ~
sudo nano /boot/config.txt
This will open up ‘config.txt', scroll down and if necessary change ‘dtparam=audio' to ‘off'. This disables the onboard audio. It should look like this when finished;
# Enable audio (loads snd_bcm2835)
dtparam=audio=off
Be sure to save the config.txt file by entering;
ctrl-x
Y
Test Software
At this point, it's time to ensure all is working correctly. At the command line you need to be in the ‘ledmap' directory so enter;
cd ledmap
sudo python3 ledmap.py
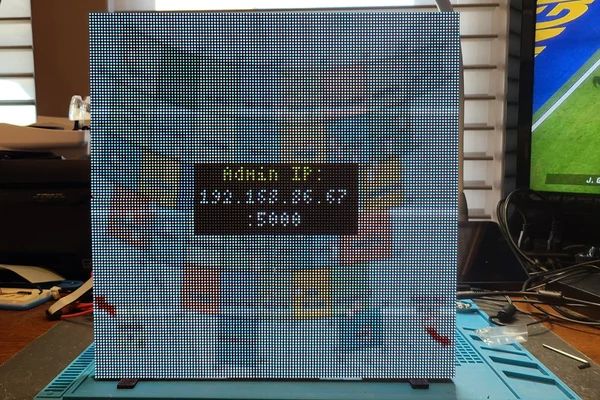
After a few moments, the LED Matrix should come up with a splash screen and an Admin Page URL. Write this URL down, as you will use it to bring up the web based admin site later. NOTE: Its very likely that the display is not as expected but this is nothing to worry about yet. We still need to configure the display size in the software. So you may need to come back after the configuration portion of the instructions to get the admin URL.
To further test the setup if desired, start the software up with a few command line arguments;
sudo python3 ledmap.py interval=120 use_wipe=0 time_display=0
This will run the software without the splash screen and without displaying the clock and will update the METAR data every 120 seconds.
Assuming all is good, its time to move on to ‘Configure Software'. If the display shows nothing, consult the trouble shooting section at https://github.com/hzeller/rpi-rgb-led-matrix and double check the wiring.
Step 3: Configure Software for Display
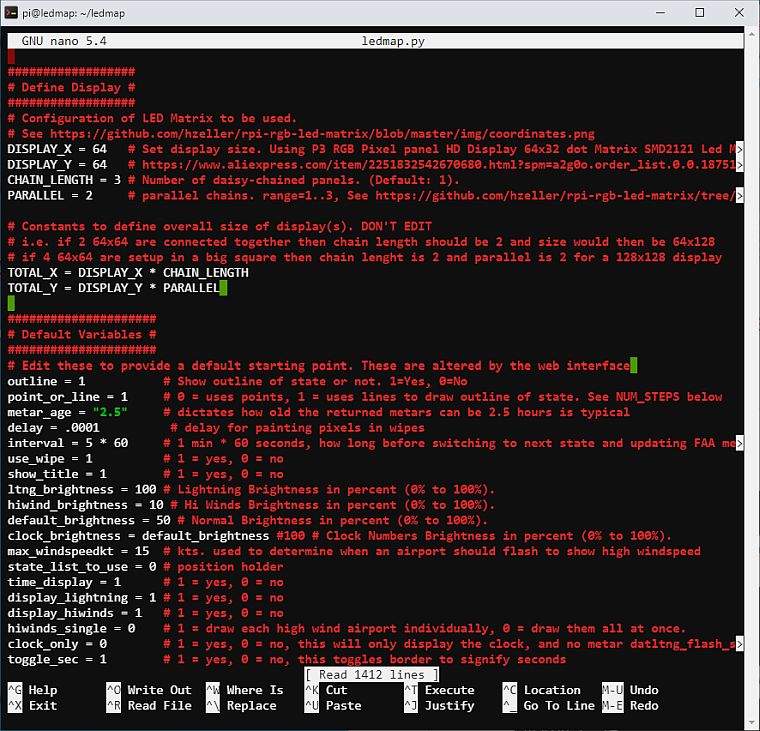
Configure the Display Size
From the command line enter;
cd ledmap
sudo nano ledmap.py
Scroll down to the section labeled ‘Define Display' and change the values listed there. For a single 64×32 Matrix display you would fill it out this way.
DISPLAY_X = 64
DISPLAY_Y = 32
CHAIN_LENGTH = 1
PARALLEL = 1
For a multiple Matrix Display using 2 rows and 3 columns of 64×64 Matrix displays it would be filled out like this;
DISPLAY_X = 64
DISPLAY_Y = 64
CHAIN_LENGTH = 3
PARALLEL = 2
Once these settings have been set, enter the following to save your changes;
ctrl-X
Y
Now retest the display by entering;
sudo python3 ledmap.py
The display should now be set up correctly and display the splash screen and the Admin page URL. Be sure to write down this URL, you will use it to access the web-based admin page.
Step 4: Run Web-Based Admin
The software provides an admin web page to make using the software easier.
From a web browser that is connected to the same WiFi network that the LED Map was set up enter the URL displayed on the splash screen. For example;
- http://192.168.1.79:5000
Your URL will be different, which is why you needed to note the URL from the splash screen. Another way to get the proper URL would be to enter your router's admin page and locate your RPi on the network and write down it's IP address. Then simply append a ‘:5000' to the end and enter into a web browser.
This will bring up a web page with a number choices which are briefly discussed below (See pic).
The Function menu has 5 options;
- LED Map Display – Main feature that will display the METAR data map
- Digital Clock Alone – Will only display the clock, no map
- Clear LED Map Display – Turn off the display and clear it to black
- Reboot RPi – Will reboot and restart the map
- Power Down RPi – Will power down the RPi correctly and will need to power cycle to start back up.
The next dropdown allows the user to select the state or states to display. There are a number of lists in which to choose from. These lists are editable if desired and will be covered in more detail in the next section.
The next part of the admin page provides checkboxes that will allow you to change the behavior of the display. Try them all and see what happens.
The next section dictates how the FAA METAR data is retrieved and how often its updated.
Finally, you can adjust some of the brightness settings.
Step 5: More Details on Configuration Files
This section provides more specific information about altering the way this software works. There are a number of files that can be changed to fit your needs. Each one will be discussed below.
admin.py
This file simply holds the software's version number but also has a ‘name=' field that can be changed to whatever you would like displayed at the top of the admin page.
scalebystate.py
This is an important file that houses the scaling information required for the state's aspect ratio to be displayed properly on the LED Matrix. There are 2 dictionaries provided, one for rectangular displays and one for square displays. It lists the state name then an [X,Y] value that can be changed to alter the width and height of the state as displayed. For instance;
"ALASKA":[1,.4],
The first number will determine how wide the state is drawn. The lower the number the wider it will be drawn. The second number will do the same for the height of the state. The lower the number, the taller the state will be drawn. If you find the aspect ratio doesn't look quite right on your display, play with these values till its where you like it.
state_ap_dict.py
This file is a list of every state along with each state's airports that currently provides a METAR. You can add or delete airports to this list if changes are desired.
usa_ap_dict.py
This file is similar to the ‘state_ap_dict.py' above except it lists the airports that will be displayed when the lower 48 states map is displayed. There are currently 3 different lists available to use in this file;
- ap_user_dict – User defined list of airports to display. Comes with 183 airports
- ap_1700_dict – A list of over 1700 US airports
- ap_3000_dict – A list of over 3000 US airports
The list that will be used is set by a constant located in the main file, ‘ledmap.py'. To change which list is used you must edit ‘ledmap.py' constant labeled ‘usa_ap_dict' located under the ‘Constants' section of the file.
state_lists.py
This file provides a number of lists populated by state names that will be cycled through on the display. This can be edited, but do not change the list names. ie. the list ‘state_single_0' should not be changed, but the contents of the list can be.
custom_layout.py
This file houses dictionaries that can be populated with the data necessary to display geographic areas other than the US and its territories, or for a custom area such as defined by a sectional map. Below is a section dedicated to how to use this feature.
Read more: LED Matrix Metar Map