
We aim to bring proper heart care to developing countries. An early detection of these pathologies its vital for an effective treatment.
The problem
According to the World Health Organization, the main cause of death in the lower-middle-income countries are related to heart disease, even in the middle to high-income countries, are in the top three.
Although, the high-income countries have access to medical care, control and treatment, in the developing countries this access is limited and expensive. In these conditions the people develop heart deseases that can be fatal if not treated properly in the early stages of the disease.
The aim of this project is to do a first prototype of a functional and cost-effective device that can detect different heart patologies. This device would allow people with a preliminary diagnosis. Even doctors could improve the effiency of their time in low-income countries, where every minute counts.
Also, in middle to high-income countries, this device would be usefull to allow people get a preliminary diagnosis and encouraging the visit to the doctor in case of some detection, preventing from some avoidable deaths.
Our solution
In order to solve the problem we are building a small portable device, based on low-cost parts. The device will consist in a main board with the processing power (like the STM32F407G-DISC1) the electronics to read the ECG signal and a small screen to show the results of the analysis.
Currently real ECG equipment is heavy and expensive. These equipments are designed to be highly reliable with a clean signal. Since our device is designed for a preliminary diagnosis, and the data will be analyzed by a software, the data do not need all the detail and signal cleanliness that humans need. Downgrading the level of detail and filtering, the device becomes light, cheap and usefull.
This would allow to be delivered easily to remote land and powered using batteries or even renewable energies (solar, wind) due to its low power consumption.
How will it work
The device has some leads that are connected to the patient body. This leads measure the change in voltage in the body that is related to heart behaviour. This signal we receive is amplified and measured with the analogue to digital converter of the STM32F407G-DISC1.
Then the data is processed by the microcontroller which has the main processing power of the project. The microcontroller would have a neural network, previously trained with an extensive dataset, that will analyse and classify the heart signal, and try to detect possible pathologies.
We are planning having a visual representation of the received data plus the output of the neural network, in order to inform the patient/doctor of the results of the analysis.
First design
The first design can be found in the following image. The first part is designed to obtain and amplify the signal of the ECG so the microcontroller can read it. Once the data is already digital the microcontroller will send it to the Raspberry Pi 3, where the neural network will extract the parameters and generate a result.
The rPi will be constantly sending the data to the TFT with the current measures of the ECG and the results of the neural network clasification.
Theory: ECG
The electrocardiograms (ECG/EKG) are the voltage signals that our heart generates when it beats. Each beat is a sequence of contractions and relaxations, that need of an electrical signal flowing through the ticker muscles in a particular order. This signals spread over the skin where, with the correct sensors, can be measured. They are calculated with the difference of the voltage between two points of the body.
These signals can be measured between several points in our body, generating different waves. In our case, we are focusing in showing the more common pattern called the QRS pattern, preceded by a P wave and followed by the Q one. This signal is measured using 3 electrodes, two near the shoulders and one in the hip.
The shape of the QRS complex can be used to determine several pathologies and the heart rate. The difference shown in an ECG between a healthy heart and one with a pathology, varies from subtle changes to completely different signals. Moreover, some pathology symptoms may appear randomly or when the doctor is not measuring. If the ECG signal could be measured and analyzed in realtime, with no human intervention, many pathologies could be diagnosticated earlier.
In other to accomplish the characterization and early diagnosis of the ECG signals many AI algorithm can be used. In our case, for the sake of simplicity and easy implementation, we choose the neural network classifier. The input to these networks, is an array of parameters, and based on that the network generate an output, that is the classification of the signal based on the parameters and the learning process.
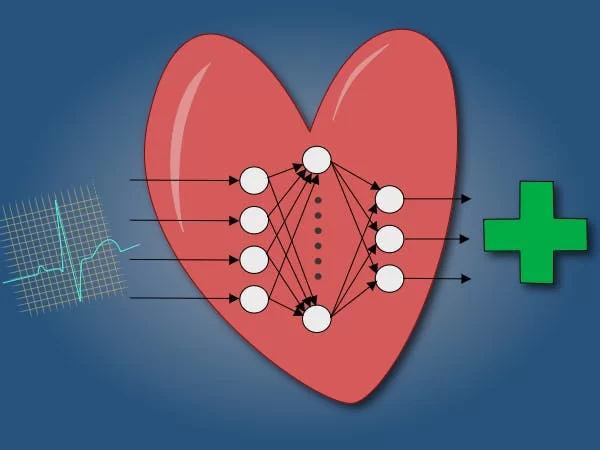
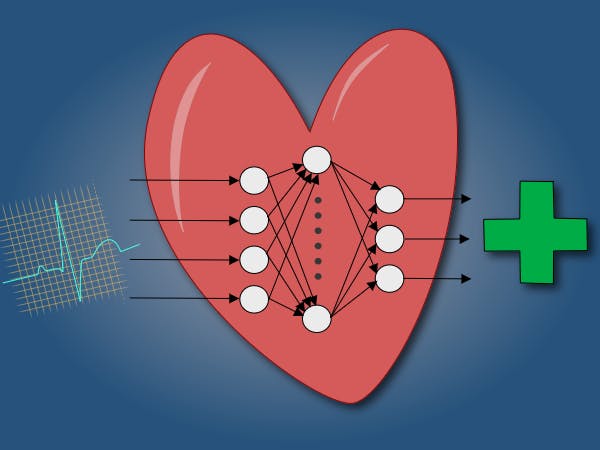
Theory: Neural Network
A neural network is composed by several neurons arranged in layers. Each layer get the input from the previous layer and calculate its output which is used by the following layer, until the last layer which output is the classification of the signal.
In order to the get the neural network working, we need to train it. We need a set of signals from which we know the expected output of the neural network. For example, if we want to tell whether a signal is healthy or it has an AV Block, we would need sample signals of both cases already classified by a doctor. Then we train the neural network until it learns what is a regular ECG or an unhealthy one. Then we can pass the real data and get the output.
To summarize, in order to work with a neural network we need to:
- Define the network, that is, how many input parameters, how many outputs, layers, neurons per layer…
- Train the network with an already known data set.
- Use the network with the parameters of the train phase.
This is a very simple explanation of a neural network, a deep insight into its operation and the different types would require a much more complex introduction, far from the scope of this project.
Technology
The core of the code is written mainly in ADA, due to the reliability of the language, which is essential when dealing with a project related to the health of patients.
Implementation: Neural Network
The first step was to implement a neural network in ADA, which is the core of the project. Looking for related information, we found that there was little done about neural networks with this language. So we found very useful to develop a generic library for neural networks in ADA, so that it could be used in other projects. This library contains the necessary tools to create a neural network, train and execute it, being useful for both the training phase of the network and the production phase.
For the training of the network, it is necessary to have an “input.dat” file with the appropriate configuration, which contains the inputs to the neural network, as well as the outputs expected. In the code, the necessary parameters must be configured in the “config.adb” file, such as the number of layers of the network, the number of inputs and outputs desired, the size of each layer or the learning speed. As output, it generates a “weights.dat” file with the weights generated for each neuron, which will be necessary for its execution in the production phase.
We provide some basic functions for the neuron body and the neuron actuator, the summation and the sigmoid functions. The system was planned so more functions can be included and configured for the network easily.
The complete library is located inside the “neural-network-lib” folder. The training of the network, as an example of use and operation, has been developed in the project inside the folder “neural-learning”. The example of the production mode of the neural network can be found in the folder “example-run-net”, which also includes an implementation of the Fast Fourier Transform, obtained from https://rosettacode.org/wiki/Fast_Fourier_transform#Ada, which we found very useful for the treatment of input signals to the neural network.
STM32
This projects is in the “STM32” folder. For the STM32 board, we had to be made modifications to the neural network, due to code incompatibility, mainly on the screen output and file processing. Due to this, this version of the STM32 library is only suitable for production, not for training the network, and the weights of the neurons have to be introduced through an “.ads” file.
In addition, modifications had to be made to the Fast Fourier Transform code, due to problems returning unconstrained elements and the intensive use of recursiveness.
A console module has been developed, using the board's USART, to be able to view the results on screen and send them to the Raspberry Pi module, using the board's PA2 and PA3 pins. USART reading has also been developed through interruptions. It can be found in the file “console.adb”.
Another of the necessary part was the use of the ADC, to obtain the information of the heartbeats, to analyze them and to send them to the neural network. For this purpose, the ADC device of the board has been configured on the pin PA4, with a resolution of 12 bits, converting the input to a value between 0V and 3.3V. It is in the file “ecgreader.adb”.
The main part of the ECG data processing is in the file “ecgprocess.adb”. Once the raw input between 0v and 3.3V is received, it performs the Fast Fourier Transform to the signal, and then the module. From this result, it extracts some parameters from the signal, which will be used later as input to the neural network. These parameters are:
- Maximum
- Minimum
- Mean
- Variance
- HaPo (frequency that divides the spectrum into two parts of the same area)
The main sequence of program execution is:
- Initialization of the console, the ADC and the neural network.
- Reading ECG data
- Data processing
- Execution of the neural network
- Sending the neural network output and ECG data to the Raspberry Pi
This is done with a real time delay of 20ms
Implementation: Python
In order to show the data in the screen a python script is selected. The script will get the data from the serial port, filter it using scipy and then plot using matplotlib.
We are aplying a lowpass filter in order to the rid of the noise, mostly comming from the main supply (50 Hz wave). We can se the effect in the signal and the spectrum in the following images.
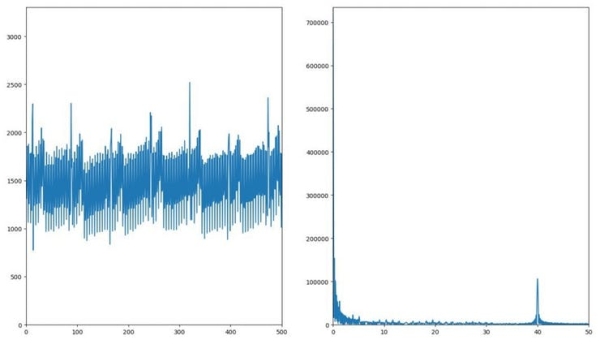
In the previous image we can see the signal directly from the ADC to the plotter. The frequency of the spectrum has an offset in the X-axis due to a not perfect sampling time. However, in order to remove the high frequencies we can use a round number. Filtering with a lowpass filter with BW of 30-40Hz we get a clean signal.
Source: Low-Cost ECG Pathology Detection with Deep Neural Networks