
| Hardware components: | ||||||
 |
|
× | 1 | |||
 |
|
× | 1 | |||
STORY
Today I’m going to show you how to make sort of a mini weather station with a Raspberry Pi. This is an ongoing project of mine that I’ve been tinkering with so I’ll share my learning with you.
A core part of the “Internet of Things” movement is the idea of devices that gather data and send it to the Internet. That data is then acted on or observed for later. It’s a simple concept and has been going on for a while but lately it’s been getting cheaper and easier to do. This project is a great example of that.
Once you complete this your Raspberry Pi will measure:
- Temperature
- Humidity
- Barometric pressure
You can send your results to:
- Google Spreadsheet on your Google Drive
What you’ll need
For this project you will need:
- Raspberry Pi 3, 2 or Model B+, Zero
- Sense HAT
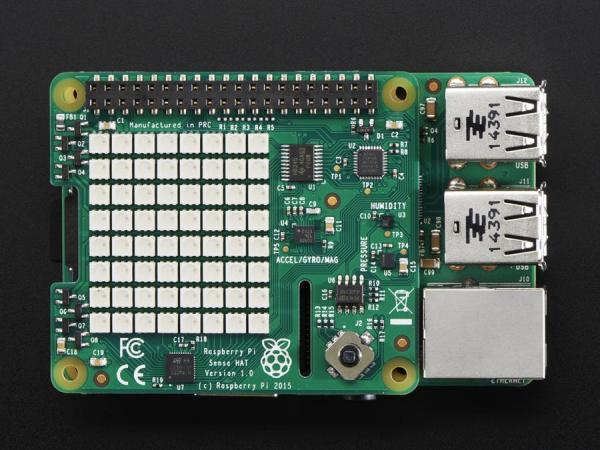
The Sense Hat
The Sense HAT is an add-on board for Raspberry Pi, made especially for the Astro Pi mission – it’s going to the International Space Station in December 2015 – and is now available to buy…
The Sense HAT has an 8×8 RGB LED matrix, a five-button joystick and includes the following sensors:
- Gyroscope
- Accelerometer
- Magnetometer
- Temperature
- Barometric pressure
- Humidity
Technical Specification
- Gyroscope – angular rate sensor: +/-245/500/2000dps
- Accelerometer – Linear acceleration sensor: +/-2/4/8/16 g
- Magnetometer – Magnetic Sensor: +/- 4/8/12/16 gauss
- Barometer: 260 – 1260 hPa absolute range (accuracy depends on the temperature and pressure, +/- 0.1 hPa under normal conditions)
- Temperature sensor (Temperature accurate to +/- 2 degC in the 0-65 degC range)
- Relative Humidity sensor (accurate to +/- 4.5% in the 20-80%rH range, accurate to +/- 0.5 degC in 15-40 degC range)
- 8×8 LED matrix display
- Small 5 button joystick
Installing the software
Install the Sense HAT software by opening a Terminal window and entering the following commands (while connected to the Internet):
sudo apt-get update
sudo apt-get install sense-hat
sudo pip-3.2 install pillow
Usage
Hello world example:
from sense_hat import SenseHat
sense = SenseHat()
sense.show_message("Hello world!")
Gather data from all the sensors
Here we will gather the data from all the sensors using an application I wrote. This reader will gather all the information and display it on 8×8 RGB LED matrix, or send it out to the internet.
Google Spreadsheets
You can output data to a Google Spreadsheet using my application. You will need to setup OAuth with Google, and create a JSON file. Instructions are here:
http://gspread.readthedocs.org/en/latest/oauth2.html
You will want to store the generated JSON file in the MiniWeatherStation.pyfolder.
One thing you will need to is open up that OAuth JSON file and look for “client_email”. It should look like this:
“client_email”: “[email protected]”,
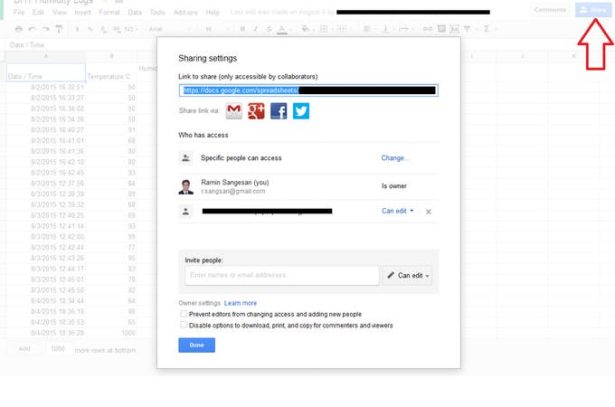
Take note of that email address value and go to your Google spreadsheet in a web browser. Using the File -> Share… menu item share the spreadsheet with read and write access to the email address found above. Make sure to share your spreadsheet or you will not be able to update it with the script!
Next, open up the MiniWeatherStation.py file and edit:
sudo nanoMiniWeatherStation.py
Replace the GDOCS_OOAUTH_JSON value with the name of your JSON file you downloaded. Set the GDOCS_SPREADSHEET_NAME with the name of your sheet. Save it. Type in :
sudo python MiniWeatherStation.py
If all your information is correct, it will start running and adding rows to your spreadsheet every 30 seconds:
Read More: Make a Mini Weather Station With a Raspberry Pi