
Overview
The Raspberry Pi 3B+ (and all other current Raspberry Pis) has built in WiFi. The “wlan0” interface is typically the default gateway of connection besides Ethernet, but it is not capable of entering “monitoring mode”. In this tutorial, we will show you how to ensure a separate network adapter is capable of monitoring mode and how to enable it. We will also go a bit into how to install and use software to utilize the monitoring mode feature, namely kismet.
Materials/Prerequisites
The main component you will need is a network adapter that is capable of monitoring mode and is compatible with the Raspberry Pi you are using. This tutorial also assumes you have the necessary drivers installed, but most network adapters associated with Raspberry Pi usage should be compatible straight out of the box. The network adapter used for this tutorial is found here: [Network Adapter]
Process
About Monitoring Mode & Some Useful Commands
Monitoring Mode
As the name suggests, monitoring mode allows us to use the network adapter to monitor traffic between devices and the network as opposed to functioning as a way of connecting to the network. A huge benefit of monitoring mode is that you don't have to be associated with a network to be able to capture packets. This analogy isn't perfect, but imagine your phone as your home and the wustl-2.0 network as your destination. As you travel from your home to your destination, a traffic camera records you passing through. Something similar is going on with a network adapter in monitoring mode. As your phone sends packets of information to a network, the network adapter is able to passively notice these packets and for this tutorial's use, record your phone's MAC Address.
Commands
Turn on your Raspberry Pi with your network adapter plugged in. Open your command line or access it via SSH (See this tutorial for details on SSHing into your Pi)
lsusb
The command “lsusb” displays all the connected devices to your Pi. The first three or so devices are probably going to be related to standard parts of the Pi. After these default devices, you should start seeing anything that you've connected to your Pi like a mouse or keyboard. Importantly, you should see your network adapter listed and its chip set. If you do not, check your physical connections. The chip set is important because it dictates whether or not certain functions are supported, and if they are supported right out of the box without additional installations. If you used the Alfa AWUSO36NH adapter listed, you should see something similar as below. The RT2870/RT3070 chip set supports monitoring mode right out of the box.
pi@raspberrypi:~ $ lsusb
Bus 001 Device 004: ID 148f:3070 Ralink Technology, Corp. RT2870/RT3070 Wireless Adapter '''// Here we can see the network adapter connected. It has a unique ID, the company name, and the chip set'''
Bus 001 Device 003: ID 0424:ec00 Standard Microsystems Corp. SMSC9512/9514 Fast Ethernet Adapter
Bus 001 Device 002: ID 0424:9514 Standard Microsystems Corp. SMC9514 Hub
Bus 001 Device 001: ID 1d6b:0002 Linux Foundation 2.0 root hub
ifconfig
“ifconfig” will give you some details about your current network configuration. Don't worry too much about most of the noise, but you should notice two interfaces called “wlan0” and “wlan1” at this point. These should correspond to your on-board WiFi interface and your network adapter respectively.
pi@raspberrypi:~ $ ifconfig
eth0: flags=4099<UP,BROADCAST,MULTICAST>  mtu 1500
        ether b8:27:eb:df:15:76  txqueuelen 1000  (Ethernet)
        RX packets 0  bytes 0 (0.0 B)
        RX errors 0  dropped 0  overruns 0  frame 0
        TX packets 0  bytes 0 (0.0 B)
        TX errors 0  dropped 0 overruns 0  carrier 0  collisions 0

lo: flags=73<UP,LOOPBACK,RUNNING>  mtu 65536
        inet 127.0.0.1  netmask 255.0.0.0
        inet6 ::1  prefixlen 128  scopeid 0x10<host>
        loop  txqueuelen 1000  (Local Loopback)
        RX packets 172  bytes 13828 (13.5 KiB)
        RX errors 0  dropped 0  overruns 0  frame 0
        TX packets 172  bytes 13828 (13.5 KiB)
        TX errors 0  dropped 0 overruns 0  carrier 0  collisions 0

'''// MAKE SURE YOU HAVE SOMETHING LIKE THIS'''
wlan1: flags=4163<UP,BROADCAST,RUNNING,MULTICAST>  mtu 1500
        unspec 00-C0-CA-97-AD-30-30-30-00-00-00-00-00-00-00-00  txqueuelen 1000  (UNSPEC)
        RX packets 23386  bytes 2945303 (2.8 MiB)
        RX errors 0  dropped 23386  overruns 0  frame 0
        TX packets 0  bytes 0 (0.0 B)
        TX errors 0  dropped 0 overruns 0  carrier 0  collisions 0

wlan0: flags=4163<UP,BROADCAST,RUNNING,MULTICAST>  mtu 1500
        inet 172.27.163.103  netmask 255.255.255.0  broadcast 172.27.163.255
        inet6 fe80::169b:bf52:d27b:bba4  prefixlen 64  scopeid 0x20<link>
        ether b8:27:eb:8a:40:23  txqueuelen 1000  (Ethernet)
        RX packets 854  bytes 929035 (907.2 KiB)
        RX errors 0  dropped 2  overruns 0  frame 0
        TX packets 823  bytes 99410 (97.0 KiB)
        TX errors 0  dropped 0 overruns 0  carrier 0  collisions 0
iw dev
“iw dev” will give you some more information about your interfaces. The important feature here is what physical layer our interfaces are using. You probably will see wlan0 under phy0 and wlan1 under phy1.
pi@raspberrypi:~ $ iw dev
phy#1
	Interface wlan1 '''// MAKE SURE YOU HAVE SOMETHING LIKE THIS'''
		ifindex 11
		wdev 0x100000008
		addr 00:c0:ca:97:ad:30
		type monitor
		channel 1 (2412 MHz), width: 20 MHz (no HT), center1: 2412 MHz
		txpower 30.00 dBm
phy#0
	Unnamed/non-netdev interface
		wdev 0x2
		addr 7e:c7:45:13:f2:b8
		type P2P-device
		txpower 31.00 dBm
	Interface wlan0
		ifindex 3
		wdev 0x1
		addr b8:27:eb:8a:40:23
		ssid wustl-2.0
		type managed
		channel 1 (2412 MHz), width: 20 MHz, center1: 2412 MHz
		txpower 31.00 dBm
iw phy phy1 info
Once we have the physical layer, we can do “iw phy phy1 info” (assuming out network adapter is connected to phy1). Usually, a network adapter defaults to the “managed” mode. However, we want to ensure it is at least capable of monitor mode past what some Amazon description might have said. Under supported interface modes, you should see monitor. If not, you need a different network adapter.
pi@raspberrypi:~ $ iw phy phy1 info
Wiphy phy1
	max # scan SSIDs: 4
	max scan IEs length: 2257 bytes
	max # sched scan SSIDs: 0
	max # match sets: 0
	max # scan plans: 1
	max scan plan interval: -1
	max scan plan iterations: 0
	Retry short long limit: 2
	Coverage class: 0 (up to 0m)
	Device supports RSN-IBSS.
	Supported Ciphers:
		* WEP40 (00-0f-ac:1)
		* WEP104 (00-0f-ac:5)
		* TKIP (00-0f-ac:2)
		* CCMP-128 (00-0f-ac:4)
		* CCMP-256 (00-0f-ac:10)
		* GCMP-128 (00-0f-ac:8)
		* GCMP-256 (00-0f-ac:9)
	Available Antennas: TX 0 RX 0
	Supported interface modes:
		 * IBSS
		 * managed
		 * AP
		 * AP/VLAN
		 * monitor  '''// MAKE SURE YOU SEE THIS'''
		 * mesh point
	Band 1:
		Capabilities: 0x17e
			HT20/HT40
			SM Power Save disabled
			RX Greenfield
			RX HT20 SGI
			RX HT40 SGI
			RX STBC 1-stream
			Max AMSDU length: 3839 bytes
			No DSSS/CCK HT40
		Maximum RX AMPDU length 32767 bytes (exponent: 0x002)
		Minimum RX AMPDU time spacing: 2 usec (0x04)
		HT TX/RX MCS rate indexes supported: 0-7, 32
		Bitrates (non-HT):
			* 1.0 Mbps
			* 2.0 Mbps (short preamble supported)
			* 5.5 Mbps (short preamble supported)
			* 11.0 Mbps (short preamble supported)
			* 6.0 Mbps
			* 9.0 Mbps
			* 12.0 Mbps
			* 18.0 Mbps
			* 24.0 Mbps
			* 36.0 Mbps
			* 48.0 Mbps
			* 54.0 Mbps
		Frequencies:
			* 2412 MHz [1] (30.0 dBm)
			* 2417 MHz [2] (30.0 dBm)
			* 2422 MHz [3] (30.0 dBm)
			* 2427 MHz [4] (30.0 dBm)
			* 2432 MHz [5] (30.0 dBm)
			* 2437 MHz [6] (30.0 dBm)
			* 2442 MHz [7] (30.0 dBm)
			* 2447 MHz [8] (30.0 dBm)
			* 2452 MHz [9] (30.0 dBm)
			* 2457 MHz [10] (30.0 dBm)
			* 2462 MHz [11] (30.0 dBm)
			* 2467 MHz [12] (disabled)
			* 2472 MHz [13] (disabled)
			* 2484 MHz [14] (disabled)
	Supported commands:
		 * new_interface
		 * set_interface
		 * new_key
		 * start_ap
		 * new_station
		 * new_mpath
		 * set_mesh_config
		 * set_bss
		 * authenticate
		 * associate
		 * deauthenticate
		 * disassociate
		 * join_ibss
		 * join_mesh
		 * set_tx_bitrate_mask
		 * frame
		 * frame_wait_cancel
		 * set_wiphy_netns
		 * set_channel
		 * set_wds_peer
		 * probe_client
		 * set_noack_map
		 * register_beacons
		 * start_p2p_device
		 * set_mcast_rate
		 * connect
		 * disconnect
		 * set_qos_map
		 * Unknown command (121)
	Supported TX frame types:
		 * IBSS: 0x00 0x10 0x20 0x30 0x40 0x50 0x60 0x70 0x80 0x90 0xa0 0xb0 0xc0 0xd0 0xe0 0xf0
		 * managed: 0x00 0x10 0x20 0x30 0x40 0x50 0x60 0x70 0x80 0x90 0xa0 0xb0 0xc0 0xd0 0xe0 0xf0
		 * AP: 0x00 0x10 0x20 0x30 0x40 0x50 0x60 0x70 0x80 0x90 0xa0 0xb0 0xc0 0xd0 0xe0 0xf0
		 * AP/VLAN: 0x00 0x10 0x20 0x30 0x40 0x50 0x60 0x70 0x80 0x90 0xa0 0xb0 0xc0 0xd0 0xe0 0xf0
		 * mesh point: 0x00 0x10 0x20 0x30 0x40 0x50 0x60 0x70 0x80 0x90 0xa0 0xb0 0xc0 0xd0 0xe0 0xf0
		 * P2P-client: 0x00 0x10 0x20 0x30 0x40 0x50 0x60 0x70 0x80 0x90 0xa0 0xb0 0xc0 0xd0 0xe0 0xf0
		 * P2P-GO: 0x00 0x10 0x20 0x30 0x40 0x50 0x60 0x70 0x80 0x90 0xa0 0xb0 0xc0 0xd0 0xe0 0xf0
		 * P2P-device: 0x00 0x10 0x20 0x30 0x40 0x50 0x60 0x70 0x80 0x90 0xa0 0xb0 0xc0 0xd0 0xe0 0xf0
	Supported RX frame types:
		 * IBSS: 0x40 0xb0 0xc0 0xd0
		 * managed: 0x40 0xd0
		 * AP: 0x00 0x20 0x40 0xa0 0xb0 0xc0 0xd0
		 * AP/VLAN: 0x00 0x20 0x40 0xa0 0xb0 0xc0 0xd0
		 * mesh point: 0xb0 0xc0 0xd0
		 * P2P-client: 0x40 0xd0
		 * P2P-GO: 0x00 0x20 0x40 0xa0 0xb0 0xc0 0xd0
		 * P2P-device: 0x40 0xd0
	software interface modes (can always be added):
		 * AP/VLAN
		 * monitor
	valid interface combinations:
		 * #{ AP, mesh point } <= 8,
		   total <= 8, #channels <= 1
	HT Capability overrides:
		 * MCS: ff ff ff ff ff ff ff ff ff ff
		 * maximum A-MSDU length
		 * supported channel width
		 * short GI for 40 MHz
		 * max A-MPDU length exponent
		 * min MPDU start spacing
	Device supports TX status socket option.
	Device supports HT-IBSS.
	Device supports SAE with AUTHENTICATE command
	Device supports low priority scan.
	Device supports scan flush.
	Device supports AP scan.
	Device supports per-vif TX power setting
	Driver supports full state transitions for AP/GO clients
	Driver supports a userspace MPM
	Device supports configuring vdev MAC-addr on create.
Enabling Monitor Mode and Configuring Boot Options/WiFi Options
Enable Monitor Mode via Command Line
Assuming everything is okay thus far, you should be able to add a monitoring interface with no issues. “sudo iw phy phy1 interface add mon1 type monitor” should do the trick. Ensure it worked by running “iw dev” again.
pi@raspberrypi:~ $ sudo iw phy phy1 interface add mon1 type monitor
pi@raspberrypi:~ $ iw dev
phy#1
	Interface mon1  '''// YOU SHOULD NOW SEE mon1'''
		ifindex 6
		wdev 0x100000003
		addr 00:c0:ca:97:ad:30
		type monitor
		txpower 30.00 dBm
phy#0
	Unnamed/non-netdev interface
		wdev 0x2
		addr 4a:f1:14:e3:78:a1
		type P2P-device
		txpower 31.00 dBm
	Interface wlan0
		ifindex 3
		wdev 0x1
		addr b8:27:eb:8a:40:23
		ssid wustl-guest-2.0
		type managed
		channel 1 (2412 MHz), width: 20 MHz, center1: 2412 MHz
		txpower 31.00 dBm
Configure WiFi Network
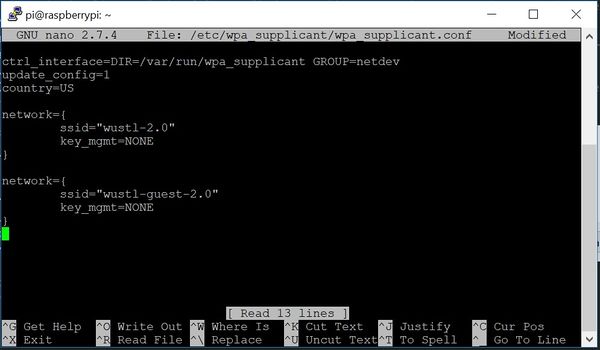
If you got this far without major issues, you should be fine. Your network adapter is at least capable of monitoring mode and was able to enter it. Next, although the Pi probably already automatically configured your WiFi networks, we will go ahead and ensure everything is okay. To edit the wpa_supplicant config file, use “sudo nano /etc/wpa_supplicant/wpa_supplicant.conf”. If you've never used nano, it is simply the basic editor built right into the command line. /etc/wpa_supplicant/ is where the file is locate (since we are not currently in the folder) and wpa_supplicant.conf is the name of the file. You should see something like below.
sudo nano /etc/wpa_supplicant/wpa_supplicant.conf
If you do not see the exact configuration, that is fine. If it is empty however, it is mandatory you add at least one network configuration. Assuming you're a WashU student, you know we log in via to WiFi via our wustl-key. If you were to connect to a more traditional WiFi connection, you might see the key_mgmt set to something like WPA2-psk and you would need to add another identifier “psk=YOUR_PASSWORD”. In this case though, assuming you're on a WashU network similar to ours, key_mgmt is set to NONE. There are more options to setup your WiFi networks, but this is the bare minimum you will need.
If you need to edit the file, simply type to edit the configuration file. Once done, press ctrl+X to exit, and y to save. Alternatively you can write with ctrl+O (similar to saving) and then exit using ctrl+X.
Start Network Adapter in Monitoring Mode on Boot
Next, we want to make the network adapter enter monitor mode after every boot on the Pi. To do that, we will edit the network interfaces configuration file. This file is sensitive and will break your WiFi if not done properly. We recommend before editing to copy the file or take a picture of it before editing. To edit the file, use “sudo nano /etc/network/interfaces”. You should see something like below, but this configuration may vary greatly. The piece you want to add to start the adapter into monitor mode is listed below as well.
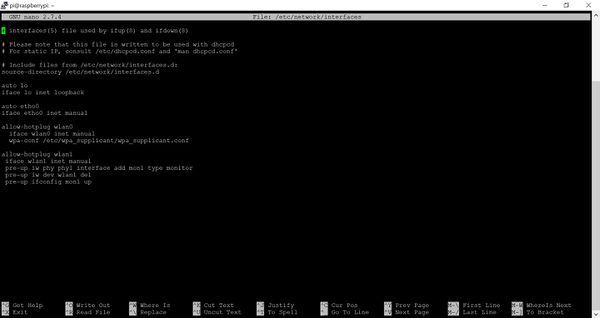
sudo nano /etc/network/interfaces
# Add these lines to your file
allow-hotplug wlan1
 iface wlan1 inet manual
 pre-up iw phy phy1 interface add mon1 type monitor
 pre-up iw dev wlan1 del
 pre-up ifconfig mon1 up
Be careful with what you do here, as this is how your WiFi network is configured. Take careful note of how your files were originally. The picture above should provide code that will work, but that may not be the case for you. Also note, indentation in Python is very important. For example, if you are using two spaces to indent, you should be consistent and not use tabs.
You should now be able to reboot and ensure your network adapter booted in monitor mode.
reboot
pi@raspberrypi:~ $ iw dev
phy#1
        Interface mon1
                ifindex 6
                wdev 0x100000003
                addr 00:c0:ca:97:ad:30
                type monitor
                txpower 30.00 dBm
phy#0
        Unnamed/non-netdev interface
                wdev 0x2
                addr 4a:f1:14:e3:78:a1
                type P2P-device
                txpower 31.00 dBm
        Interface wlan0
                ifindex 3
                wdev 0x1
                addr b8:27:eb:8a:40:23
                ssid wustl-guest-2.0
                type managed
                channel 6 (2437 MHz), width: 20 MHz, center1: 2437 MHz
                txpower 31.00 dBm
Adding Monitoring Tools (Kismet)
Thus far, we've enabled monitor mode on the network adapter on startup. But how do we control the network adapter to do what we want? That's where some sort of monitoring software comes into play. Some popular ones are Wireshark and kismet, but here we'll cover the absolute basics of how to install kismet and get it working. Things change, and so kismet may be different, updated, or not work at all when you see this. See external references on this page for the updated process (if it exists).
Install Dependencies
First install dependencies needed for kismet. These are libraries/packages that kismet needs to run.
$ sudo apt install build-essential git libmicrohttpd-dev pkg-config zlib1g-dev libnl-3-dev libnl-genl-3-dev libcap-dev libpcap-dev libnm-dev libdw-dev libsqlite3-dev libprotobuf-dev libprotobuf-c-dev protobuf-compiler protobuf-c-compiler libsensors4-dev
It should go through each dependency and install them. You don't need to pay attention to the output too much, but ensure there are no major errors or command errors. We also need something called python-requests.
sudo apt install python python-setuptools python-protobuf python-requests
This SHOULD be all you need, but there are a lot of optional add-ons. See external reference.
Download kismet from GitHub & Install
Clone the repository
git clone https://www.kismetwireless.net/git/kismet.git
Get into the folder with kismet, and configure it.
cd kismet
./configure
Compile kismet. Consider using make -j CORE_NUMBER to utilize more than one CPU core so it goes faster, but this might crash your Pi if it can't handle it. Ex. “make -j 4” will use all 4 cores. Not necessary, stick to just make to be safe. NOTE: This will take a substantial amount of time. Give or take ~30 minutes – 1 hour. If it fails, reduce the cores and look into your RAM allocation if you get a virtual memory error.
make
Install kismet
sudo make suidinstall
Add your user to the kismet group.
sudo usermod - aG kismet $USER
Reboot to log out and back in
reboot
Ensure you're in the Kismet group. You should see “kismet” listed among others
pi@raspberrypi:~ $ groups
pi adm dialout cdrom sudo audio video plugdev games users input netdev kismet '''<--- Should see kismet listed''' gpio i2c spi
Edit kismet's configuration file. We recommend reading about this, as there are a ton of options. To start kistmet, we need to assign a source.
sudo nano /usr/local/etc/kismet.conf
Once in, find and uncomment the line that reads “#source = SOMETHING” such that it looks like something below. You'll probably have to scroll down to find this section, and don't worry if it's slightly different, kismet has changed syntax and default config files several times.
# See the README for more information how to define sources; sources take the
# form of:
# source=interface:options
#
# For example to capture from a Wi-Fi interface in Linux you could specify:
source=wlan1 '''// You'll need to uncomment and change this line'''
#
# or to specify a custom name,
# source=wlan0:name=ath9k
#
# Sources may be defined in the config file or on the command line via the
# '-c' option.  Sources may also be defined live via the WebUI.
#
# Kismet does not pre-define any sources, permanent sources can be added here
# or in kismet_site.conf
Success! You should be able to start kismet now using just:
kismet
Alternatively, you can ensure it starts on the correct datasource if that does not work or you do not want to edit the config file. Also consider replacing wlan1 with whatever you named your monitoring interface, in this tutorial we told you to name it “mon1”.
kismet -c wlan1
You can also use the web browser for kismet's GUI. Open your browser and navigate to “http://localhost:2501“. From there, follow the instructions to create a login for the first time, and explore the GUI. This was a basic introduction to you started to kismet and by no means is the only way to configure it. NOTE: You'll need to do this on your Pi if that is not clear. It's running on the localhost meaning it's hosted locally on the Pi. This also means you'll need to use a monitor, keyboard, and mouse if you want to interface with this UI.
Capturing Data
Kismet has its own logging system with an abundance of configurations and information. However, this can be daunting (as it was for us) and very confusing on how to access as Kismet is constantly updating. One option is to take all the information that is spewed out in console, and instead direct that into a text file. Regular expressions can be used to capture only what you want. For example, we used regular expressions to capture the MAC addresses we wanted from kismet. More information on this portion can be found on our project page listed further below.