
Radio emissions from sky sources like Sun and Jupiter can be received and converted to digital domain for processing.
UPDATE 3 – May 7, 2018
Please note that starting from version 9 the software makes usage of latest Skyfield version (1.3). You can install Skyfield using pip install skyfield
It is no longer necessary to install using pip install skyfield==0.6.1
I also fixed a bug about proper management of negative (southern) longitude values.
UPDATE 2
Many thanks to Dave Typinski for the additions/corrections/phase plane probability map I added the various edits to paragraphs “Which kind of signals could I receive ?”, “A bit of scientific background”, “About CML-Io Phase Plane Probabilities”.
UPDATE 1
I updated the software used in this project to use a different FFT library and different file format for improved performance and reduced storage space.
New software is available on github here
This new version makes use of a modified version of rtl-power-fftw by Klemen Blokar and Andrej Lajovic. The new sources are available here
Old version of the software is available here
All the software has been built and tested both on Raspberry PI 2 and 3.
It runs well also on a Debian Jessie virtual machine.
rtl_power_fftw can be compiled also on Windows but I did not try this yet.
Amateur radio-astronomy with your Raspberry PI
Amateur radio-astronomers built several devices in order to receive, listen and/or display signals from outer space sources, many use custom made radio receivers, others use HAM radio receivers. Recently, various experiments have been done using the cheap rtl-sdr dongles (radio receivers originally meant to listen radio and watch TV on your laptop).
With this project I want to try receiving radio emissions from the Sun or Jupiter and its satellite Io. I want to build an automated radio station, cloud connected as an IoT device that any amateur could easily replicate, joining the project and forming a collaborative, open science effort to easily share the spectrograms of the received emissions.
Which kind of signals could I receive ?
It is very easy to receive Radio Frequency storms from the Sun, but also Jupiter produces strong RF emissions. You can receive radio emissions from these sources on different frequencies. The upper part of the HF band ( between 10 and 30 MHz ) is often the target of scientific monitoring for both Sun and Jupiter. Many other frequencies can be monitored up to 1.7 GHz with these radio dongles but I will focus on the HF band with this project.
A bit of scientific background
Jupiter decametric radio emission, first discovered by Burke and Franklin in 1955, can be received between 15 and 30 MHz with a modest antenna array. The Earth's atmosphere attenuates the emission progressively more the further one looks below 15 MHz. Jupiter’s magnetic field strength limits its decametric emission to a maximum of slightly under 40 MHz, but Jovian emission also gets weaker the higher one goes in frequency. Most Jovian emission above 30 MHz is weak, requiring large antenna arrays to see it.
You can read the whole story of the discovery of Jupiter’s radio storms on the wonderful Radio Jove NASA website . On the same website you will find the description of a very good dedicated radio receiver on 20.1 MHz .
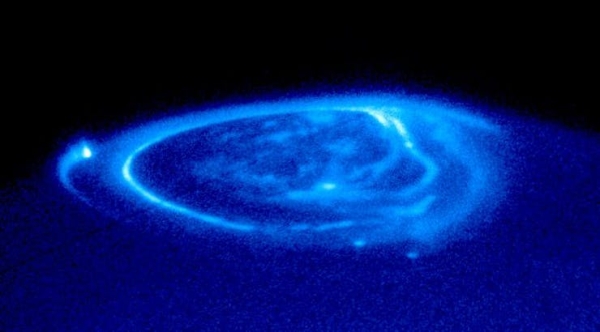
The tuning frequency is not very critical since the radio storms can be received across most of the HF spectrum. The emissions are produced by the interaction of charged particles with the Jovian magnetic field. The Jovian magnetic field is about 20,000 times stronger that Earth’s. As with Earth’s aurorae, the Jovian magnetic field is responsible for aurorae formation in Jupiter’s upper atmosphere (like pictured below by Hubble). The Jupiter emission observed in the HF band does not come from the aurorae, but from a region around 20,000 km above the visible cloud layer.
The relative geometry between Jupiter, its satellite Io, and Earth has been observed to have a modulating effect on the emission, making it more or less likely to be observed at different times. There's a probability distribution chart that you will find in various scientific papers that has been built based on years of data logging since 1957. Data is still being collected and the probability parameters updated.
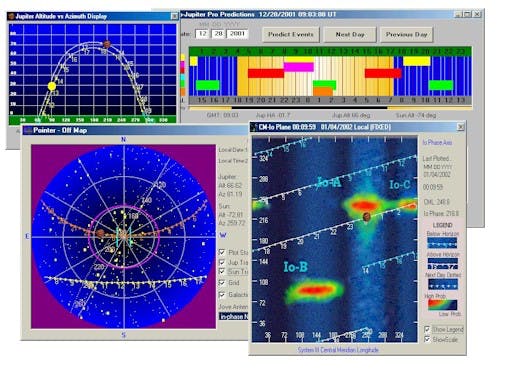
It is being used by some programs to forecast and display the best listening periods. Here is an example:
The plot above, called a CML-Io Phase Plane Probability Map (or just “phase plane” for short), is an adaptation from the probability map used by Radio Jupiter Pro.
Central Meridian Longitude tells us what part of Jupiter is facing Earth, while Io Phase tells us where Io is in its orbit relative to superior geocentric conjunction (the point in its orbit furthest away from Earth, directly behind Jupiter).
The zone boundaries (with the exception of Io-D) are marked according to the University of Florida Radio Observatory (UFRO) definitions; see https://ufro.astro.ufl.edu/decframe.htm . UFRO does not define an Io-D zone, so the Io-D zone is marked according to the definition provided by Carr, et al. in “Physics of the Jovian Magnetosphere” (1983).
About CML-Io Phase Plane Probabilities
The Io-CML phase plane image above attempts to depict the relative probability of receiving Jovian emissions at 20.1 MHz. This is done by first making an average of probability data generated from observations made at 18, 20 and 22 MHz at the University of Florida Radio Observatory (UFRO) from 1957 to 1994. The resulting average is then scaled so that the peak probability, in the Io-B source region, becomes 100% relative probability. The probability of observing Jovian emissions is affected by many variables. Some of these are the observing frequency, transparency of the earth's ionosphere, duration of the observing session, antenna gain, receiver sensitivity, galactic background noise level, man-made noise level, position of Jupiter relative to the Sun, and the jovicentric declination of Earth. While this image is a useful guide for the Jove observer, it cannot be used to predict events with absolute certainty.
Experience with small antenna arrays and swept frequency spectrographs shows that 100% relative probability is perhaps 50% absolute probability. That means even for the high-probability Io-B zone, one has only a 50% chance of observing Jovian emission when Jupiter, Io, and Earth are in such a configuration.
Thanks to Drs. Chuck Higgins, Francisco Reyes, and James Thieman, for their assistance in making this UFRO data available, and to Dave Typinski for generating the phase plane graphic image above.
Here is the same phase plane and probability data represented in 3D:
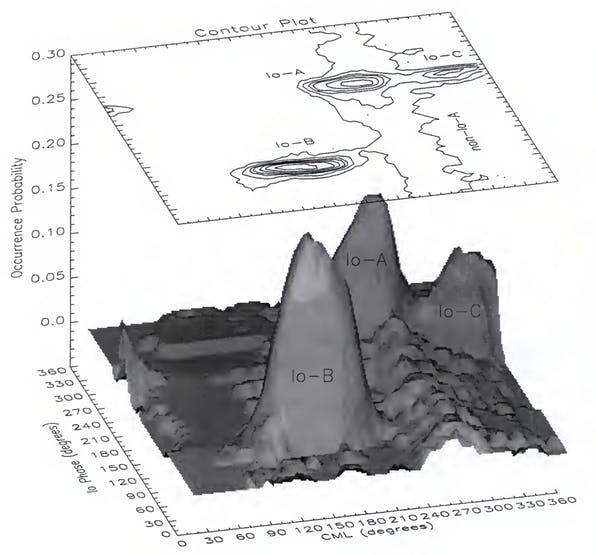
3D plot above is from Figure 1.4 in Higgins, A New Determination of Jupiter's Radio Rotation Period, University of Florida (dissertation) (1996). It represents observations made at the University of Florida Radio Observatory from 1957 to 1994 at 18, 20, and 22 MHz.
Book reference
You can find additional information on Jupiter radio emissions in this book by Jeff Lashley: The Radio Sky and How to Observe It
Software to plan your radio scan sessions
On windows you can use Radio Jupiter Pro:
On your Raspberry I'm providing a python script named jpredict.py (see my github code repository) that will output the predictions in text format. It's a port to python of an older QBasic program whose original source can be found at this web page together with good explanations about the theory and instructions to build a folded dipole antenna.
You can find the python porting here on Stackoverflow and here on github: https://github.com/adamk/Jovian-radio-emission-flagger
Warning: that version will give general predictions, not specific to your observing position. So, if Jupiter is below the horizon for you when the program predicts emissions… it will be actually impossible for you to receive them.
I heavily modified that version adding the wonderful python package SkyField by Brandon Rhodes, to calculate event predictions for your geographical position, you can specify latitude and longitude in file radioConfig.py .
Here below, you can see an example output of jpredict.py where for each UTC date time, the predicted event type is shown (if any):
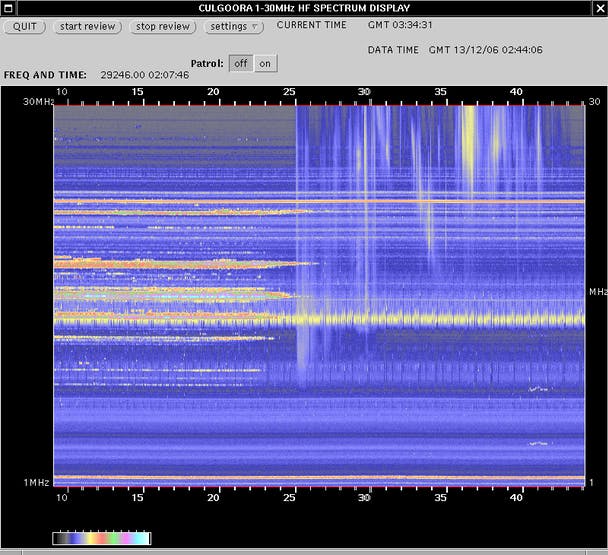
Also the Sun can be received
An example of a solar flare radio burst and fadeout as received on Earth (Culgoora Observatory, Australia):
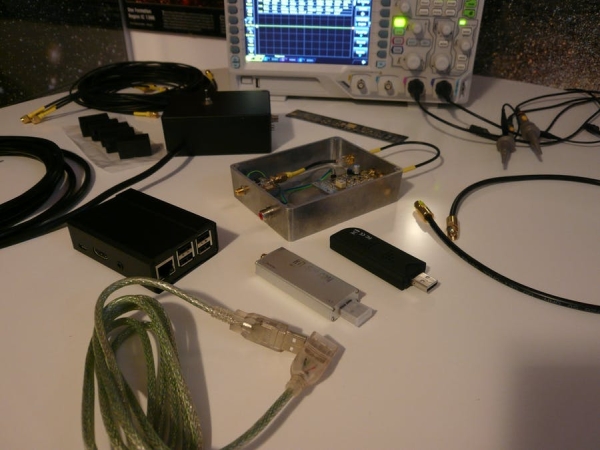
As I wrote in the introduction, in this project I'm focusing on a different approach to radio data collection: I will use an RTL-SDR usb dongle : It is essentially a consumer device originally designed as a TV tuner for DVB-T to be used on computers through a USB port.
Recently, a new set of software driver and programs have been written and upgraded by various people. I'm using the version that has been written by keenerd . This sw allows easy tuning on various frequencies, saving on disk the strength of the received signals. Plotting the signal strength data vs time you obtain a spectrogram like this:
Signal strength is calculated by program rtl_power performing FFT transformations on the digital stream of data that comes from the tuner via the USB port. Different colours are assigned to the signal strength values plotted using a specified palette visible on the right.
Note: version 2 of my python programs now use a modified version of rtl-power-fftw (see update note at top of this project page).
My requirements
I would like to keep the radio and data processor switched on for several hours per night (or potentially always). Using a Raspberry PI 2 I could have a low power consumption (about 2 Watts), so I would perform all the following directly on the R-PI:
- connect directly the RTL-SDR USB dongle receiver to the R-PI
- do the radio spectrum scan and data writing directly on the R-PI microSD
- produce the spectrum image on-board from that data
- publish on the web the resulting image and/or data sending to the Amazon AWS cloud for centralized storage
- send push notifications (MQTT) to other amateur observers for open science data sharing
- I would envision the adoption of this simple system by several amateur radio-astronomers that could form a network of distributed radio stations, connected as IoT devices to the central repository
- free usage of the publishing system should allow easy access to historical data stored on AWS S3
- the message based notification system should facilitate the integration with other systems and/or further study / processing
- the proposed design should work for most of the usual radio-astronomy frequencies. I will use the recommended 18-24 MHz frequency range, probably the most used one for Jupiter-Io radio storms.
Source: Radio-Astronomy with RTL-SDR, RPi and Amazon AWS IoT