
Introduction
Health is always an important concern. However, the health of modern people is always interfered by various potential but dangerous factors, such as high blood pressure, and abnormal heart rate. High blood pressure, also called hypertension, increases the burden of the heart to pump blood circulation in the blood vessels. Hypertension is one of the major risk factors for stroke, myocardial infarction (MI), heart failure, aneurysms (such as aortic aneurysms) and peripheral arterial disease. It is also one of the causes of chronic kidney disease. And a normal resting heart rate for an adult ranges from 60 to 100 beats a minute. Although there's a wide range of normal, an unusually high or low heart rate may indicate an underlying problem.
In order to monitor health indicators regularly at home, we design a low-cost health monitor system that can measure blood pressure, heart rate, and body temperature.
Objective
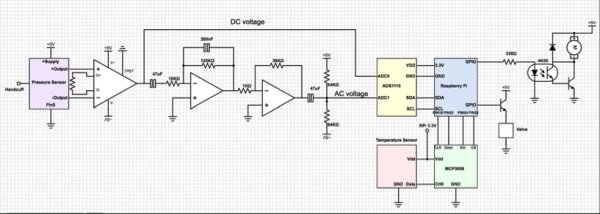
Our final project is to design and build a health monitor that can measure blood pressures, heart rate, and body temperature through an inflatable handcuff, and then display the test results on a computer screen. The device is consisted of four majors parts: hardware (computer monitor, handcuff, tygon tubing, and 3-way splitter), analog circuit, motor and valve control circuit, and Raspberry Pi 3. The goal is to integrate all the circuit elements, so that all the health indicators can be measured through the handcuff.
High-Level Design
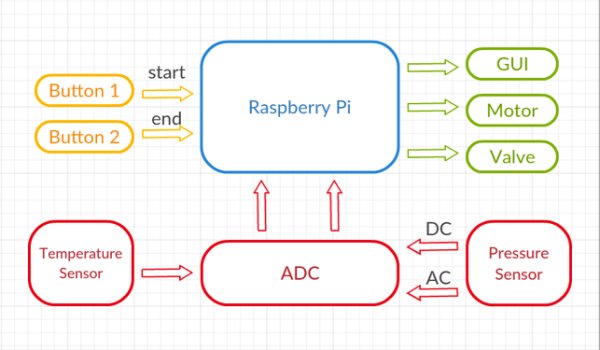
High-Level Block Diagram
Body Temperature Measurement Mechanism
In our design, we chose to use TMP36 as the body temperature sensor. TMP36 is a low voltage, precision centigrade temperature sensor. It provides a voltage output that is linearly proportional to the Celsius temperature, and the output scale is 10 mV/°C. The advantage of this temperature sensor is that it does not require any external calibration to provide typical accuracies. We use an ADC to read the output voltage on the Vout pin, and the reading can be converted to temperature easily.
Blood Pressure Measurement Mechanism
In our daily life, a sphygmomanometer is the most common device used to measure blood pressure. Sphygmomanometer is composed of a cuff, which can be inflated by a manually operated bulb and deflated by a valve, and a mercury manometer to measure the pressure. When start measuring, the cuff need to be inflated rapidly to 180 mmHg (higher than systolic pressure). Then, open the valve to release air from the cuff moderately. At this time, doctor need to listen with the stethoscope and observe the sphygmomanometer at the same time. When cuff pressure reaches the patient’s systolic pressure, the knocking sound appears. At the point when the knocking sound disappears, the corresponding pressure is the patient’s diastolic pressure [1].
In our design, we simulate this blood measurement processes. When the program starts, motor will pump air into the handcuff until the pressure is about 180 mmHg, which guarantees the pressure is higher than the average systolic pressure. Then, the air will be moderately released from handcuff by opening the valve for 0.05s every 4s. While the handcuff is moderately deflated, we measure the small oscillations of air pressure in handcuff caused by heartbeats. The systolic pressure will be the point at which the obvious oscillations appear, and the diastolic pressure will be the point at which the oscillations disappear. At these processes, ADC will convert all the signals reading from pressure sensor, and will send them to Raspberry pi for further calculation.
Heart Rate Measurement Mechanism
In our design, heart rate measurement is done at the same time as blood pressure measurement. Depending on our observation, after systolic pressure appears for a few second, the heart pulse is strongest and stable. In this stable period, the heartbeat count and duration time are recorded. After all the measurement is done, heart rate can be simply calculated by dividing the heartbeat count by duration time in minute unit.
Hardware and Software Tradeoffs
Several tradeoffs for the hardware part and software part were made in this project.
For hardware part, we initially use MCP3008 (10-bit resolution with SPI serial interface) as the ADC for entire project. However, when we test the behavioral of pressure sensor, we find that the ADC reading is really inaccurate, and is not same as what we expected. At this point, we decide to give up using MCP3008 and change another ADC with higher accuracy, and finally we choose ADS1115 with 16-bit resolution.
Another tradeoff we made for hardware part is the method heart rate measurement. Initially, we try to build an infrared heart pulse sensor by using an infrared emitter and detector. Nevertheless, the reflection from fingertip is really low, which largely affect the measurement accuracy. Besides, if we keep using this heart pulse sensor, the users are required strictly cover the emitter and detector. If the emitter and detector are not completely covered, the measurement accuracy will be largely reduced. As a result, we give up this design, and we find a better solution, as the description above in heart rate measurement mechanism part.
For software part, we design to plot the electrocardiogram at the same time as we read data from pressure sensor. However, plotting a real time electrocardiogram is slow, and it actually significantly reduces the data-sampling rate. The data-sampling rate is reduced from 0.05s per sample to almost 0.8s per sample. With the slow sampling rate, pulse detection is really inaccurate, and the result is also affected. In consequence, we choose to make the measurement first, and record all the data into a txt file. After measurement stage, read data from the txt file and plot the electrocardiogram with the data read from the txt file.
Hardware Design
Temperature Sensor
TMP36 is a low voltage, precision centigrade temperature sensor. It provides a voltage output that is linearly proportional to the Celsius temperature, and the output scale is 10 mV/°C, shown in Figure 2. The advantage of this temperature sensor is that it does not require any external calibration to provide typical accuracies.

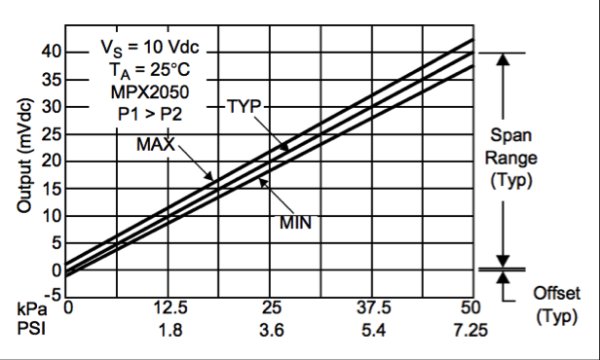
Pressure Sensor
We use MPX2050GP pressure sensor to measure the pressure of air in handcuff. MPX2050GP provides a highly accurate and linear voltage output. The output voltage is directly proportional to the applied pressure, shown in Figure 3.
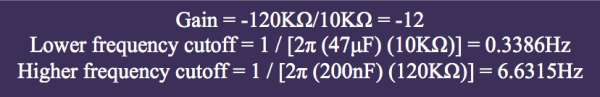
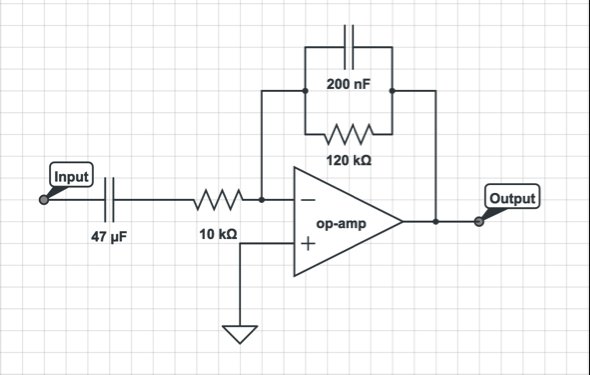
Filters
The filter we use is an active band-pass filter, aiming at providing a large gain and filtering out noises to improve the signal to noise ratio of the output. The band-pass filter circuit is shown in Figure 4.
Amplifier
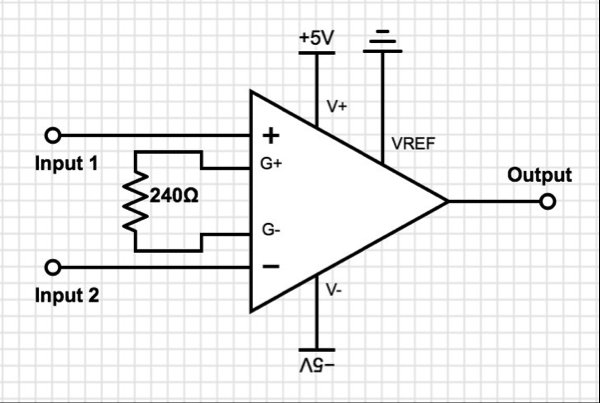
The output signal from pressure sensor is very small, so we have to amplify the signal for further processing. We choose AD620, which is a low cost, low power, high accuracy instrumentation amplifier that requires only one external resistor to set gain. According to AD620, adding resistors between Pins 1 and 8 can change the gain.

We need to amplify the pressure sensor signal approximately 200 times, and according the above equation, we choose 240-ohm resistor as the RG. And the gain calculated by the above equation is 206.8333. The amplifier circuit is shown in Figure 5.
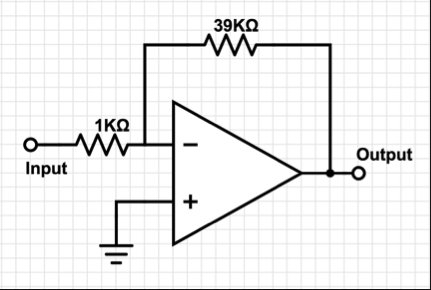
After band-pass filter, we use another amplifier to amplify the AC output further. The amplifier schematic is shown in Figure 6.
Motor Cntrol
Motor is control by Raspberry Pi GPIO pin. Motors are typically noisy, high current driven, and could cause inductive spikes to wipe out the transistors in Raspberry Pi, so we use an optoisolator to completely isolate Raspberry Pi from the motor, and the optoisolator (4N35) allows us to protect the rest of the circuit from unintended side-effects of the motor. A diode is designed to place across the motor, in order to short out spikes when the motor is turned off. Motor control circuit is shown in Figure 6.

Valve Cntrol
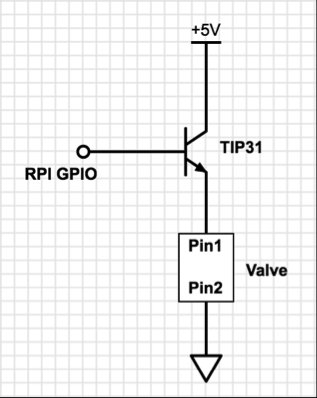
Valve is simply control by using an NPN transistor as a switch. The base of the transistor is connected to Raspberry Pi GPIO pin. In this design, to open the valve, we simply set the GPIO pin high, and to close the valve, we give the GPIO pin low. The schematic of valve control is shown in Figure 7.
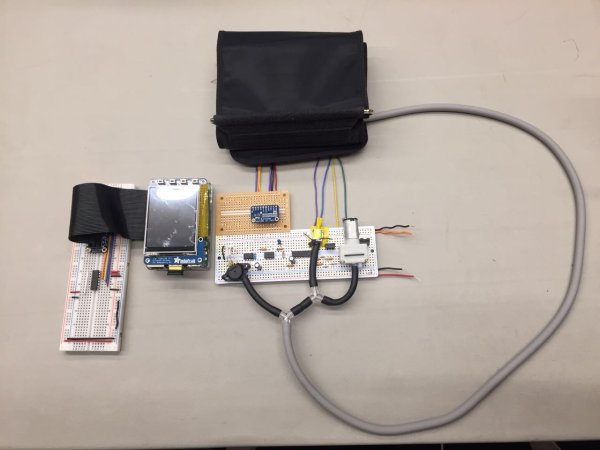
Hardware Integration
Software Design
State Diagram
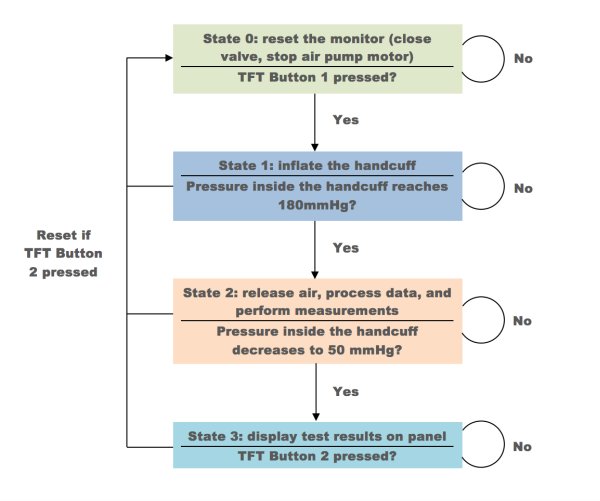
The health monitor control system is consisted by 4 states:
1) State 0: the reset state, ensuring the health monitor is in the sleep mode before starting measurement. The air pump motor is stopped and air valve is open, so that no air can be pumped into the handcuff in any situation. When the first button on the TFT is pressed, the system will move to state 1, otherwise, loop in state 0.
2) State 1: start inflating the handcuff until the pressure inside the cuff reaches 180mmHg. Once the pressure is high enough, the system will move to state 2. If emergency happens, the second button on the TFT can be pressed at any time to release the air immediately by resetting to state 0.
3) State 2: the core state of the health monitor, having a relatively heavier workload than other states. In this state, the handcuff starts to release air slowly through the voltage control air valve. Meanwhile, the program will read signal from ADC, process the data, compute the heart rate and blood pressure, and also send the raw data to an output file for the future use of visualizing heart pulse. When the pressure inside the cuff decreases to 50mmHg, at which point all the measurements are done for most people, the system will jump to state 2.
4) State 3: measure body temperature, display test results on the panel, and visualize heart pulse. Most measurements are completed in state 2, except body temperature. Once the body temperature is obtained, all the test results will be displayed in the panel. And, in this state, heart pulse visualization will be performed. Heart pulse visualization is time-consuming because it really takes some time for Raspberry Pi to animate he heart pulses and to draw them in a single plot. After the cardiogram is completed, the system will stay in state 3 unless the reset button or quit button is pressed
Analog-to-Digital Converter
MCP3008
The MCP3008 is 8-channel 10-bit analog to digital converter, which is greater for just reading simple analog signals, like from temperature sensor. In our first attempt, we tried to use MCP3008 for both temperature sensor and pressure sensor. Later we found that MCP3008 works perfectly fine for detecting signal from temperature sensor, but not for heart pulse detection through the pressure transducer, which need to be very sensitive and requires more bit to get a more accurate data. So, we keep the MCP3008 for temperature measurement and move on to ADS1115 for blood pressure measurement for a better result.
We develop a 100-line python script to read data from MCP3008, which is listed in the Code Section. The logic is to read SPI data from MCP3008 using four GPIO pins: SPIMOSI, SPIMISO, SPICLK, and SPICS.
ADS1115
The ADS1115 are great analog to digital converters that are easy to use with the Raspberry Pi using its I2C communication bus, which is a higher precision 16-bit ADC with 4 channels. The 16-bit signed integer value can represent decimal number form 0 to 32767. Since the ADS1115 is supplied by 3.3V from Raspberry Pi, 0 and 32767 are corresponding to 0 and 3.3V.
We need to install the Adafruit ADS1x15 Python library from the source on Github. The library is installed by running the following commands in the terminal.
sudo apt-get update
sudo apt-get install build-essential python-dev python-smbus git
cd ~
git clone https://github.com/adafruit/Adafruit_Python_ADS1x15.git
cd Adafruit_Python_ADS1x15
sudo python setup.py install
To use the ADS1115 in our Python program, we import the Adafruit_ADS1x15 and create an ADS1115 instance, adc = Adafruit_ADS1x15.ADS1115(). Then data can be read from the selected channel x, data = adc.read_adc(x, gain=GAIN), where x is a integer from 0 to 3.
In our case, the dc voltage represents the pressure inside the handcuff is read from A0, and the ac signal indicates the heart pulse is read from A1.
Motor and Valve Control
The motor and valve are both controlled by Raspberry Pi. They are connected to two NPN transistors, and the base pins of the transistors are connected to GPIO 21 and 16. When GPIO is in high state, motor is activated and valve is open.
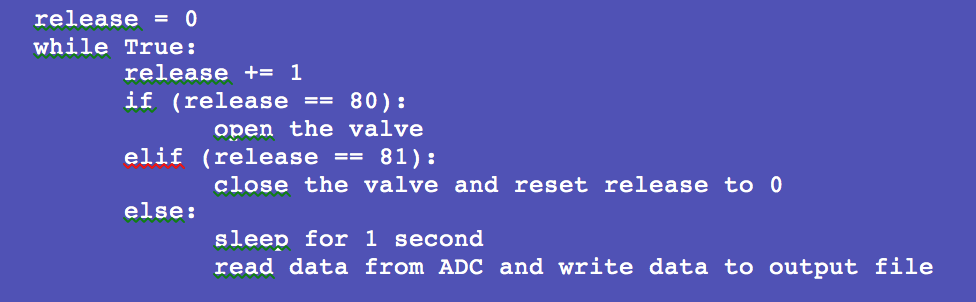
One problem with our air valve is that it only has two states: open and close, which means the valve cannot control the airflow. If we set the valve to open during state 2, all the air in the handcuff will be released in just a second. The process is so quick the pressure sensor or the Raspberry Pi cannot capture that heart pulse signal. To solve problem, add some code to our program to let the valve release air every 4 seconds, and the duration is 0.05 second per time. By doing this, the handcuff deflates slowly.
Another problem of deflating the handcuff is that air deflation influences the pressure inside the handcuff. Because of this, during the 1 second after the valve stops releasing air, the pressure inside is unstable producing noisy data that blocks the real heart pulse signal. So, we make the program sleep for 1 second to allow the pressure inside the cuff return to a stable state and then read data from ADC. The pseudo code for valve control is shown below.
Body temperature measurement
TMP36 is the temperature sensor in the monitor system. TMP36 generates an analog signal that is linearly proportional to temperature. The temperature range is from -40 degrees C to 150 degrees C and the output range: 0.1V (-40 degrees C) to 2.0V (150 degrees C). We use MCP3008 to convert the analog signal from TMP36 to digital signal for Raspberry Pi. Since MCP3008 is power by 3.3V by Raspberry Pi and has 10 bit, which correspond to 1024 in decimal, 1 bit indicates 3300.0/1024.0 mV. Then, we convert the digital signal to temperature in Celsius using the following equation.
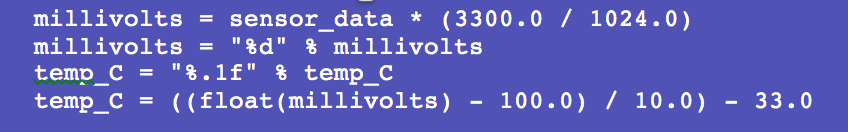
The temperature reading from TMP36 will be stable after about 10 seconds, so we put the sensor measurement in the main while loop and display the final temperature with heart rate and blood pressure on the panel at the same time.
Heart rate measurement
During the measurement, heart pulse appears right after systolic pressure and disappears before diastolic pressure. Heart pulse pumps the pressure inside the cuff oscillates, which consequently causing the data read from ADC oscillates as well. The following figure shows the processed AC output signal indicating the heart pulses detected by the pressure sensor.
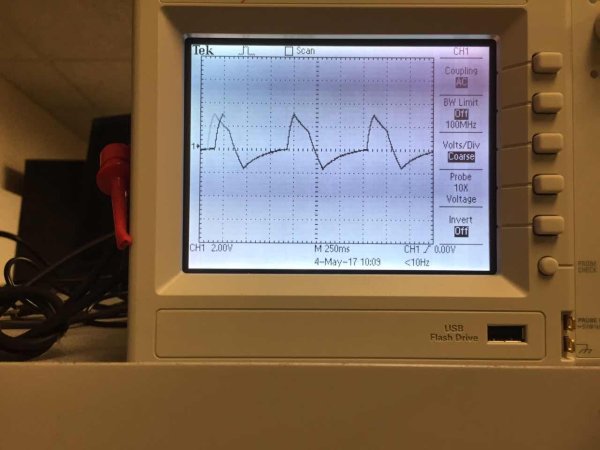
As shown in the figure, the waveform is very sharp, which represents the heart pulse clearly. This figure is capture when the heart pulse is steady and relatively strong. But, in fact, the intensity of heart pulse varies from different time intervals. When the heart pulse just appears, the signal may fluctuate because the force from the handcuff can still occlude the artery, preventing blood flow. So, some weak heartbeats may not be detected. After the pressure inside the cuff decreases to some level, most heartbeats are strong enough to be detected and their digital signal can reaches to a level over 25000 from ADC. The steady state often starts after 15 seconds from the beginning of measurements.
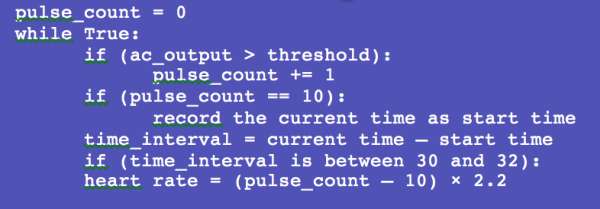
In the code, we choose the time interval where the waveform oscillation is strongest. We define the interval starts after 10 heartbeats have been detected. And then count the heartbeats for 30 seconds, the heart rate can be calculated by multiplying 2 to the count of detected heartbeats. In reality, not all the heartbeats can be detected, so after calibrating, we found multiplying 2.2 is reasonable to get a relatively accurate result of heart rate. The following pseudo code shows the basic logic of heart rate measurement.
Blood pressure measurement
As we mentioned in the previous section, systolic pressure is measured when the first heartbeat appears and diastolic pressure is measured when heartbeat cannot be detected completely. The logic is simple, but, in fact, we still need to deal with noisy data. Since the pressure sensor is very sensitive, even a small movement of the user can generate a big noise that looks like a heartbeat appears, which will decreases the accuracy of test result dramatically. To minimize the influence of noisy data, our program outputs systolic pressure when 3 heartbeats have been counted, and diastolic pressure when the number of non-pulse data is greater than 40, which is equivalent to 40×0.05 second = 2 seconds. The pseudo code is shown below.

Heart Pulse Visualization and User Interface
At the beginning, we tried to visualize heart pulse in a real-time manner. But, we cannot find a proper Python library that can perfectly support this function. We tried Plotly, a paid visualization tool that is good for creating chart and scientific graphs. Plotly can achieve real-time data sensing, but the drawback is that it is an online tool, so graph can only be displayed on browser. Then, we moved to matplotlib, a plotting library for specifically for Python and its numerical mathematical extension Numpy. The animation of heart pulse can be achieved by using animation function inside matplotlib, but this function blocks the execution of the program. After trying many possible methods, we still cannot solve the problem. Then, we found drawing data on the panel using matplotlib is really a heavy work. No matter how hard we tried to speed up the execution, the drawing process is still slow and blocks the data reading from ADC. To let the data can be read smoothly, we decide to read and process data only in state 2, and visualize the heart pulse in state 3. In state 2, data is sent to an output file that is read later in state 3 for visualization. The state diagram below shows how we animate the heart pulse signal.

Results
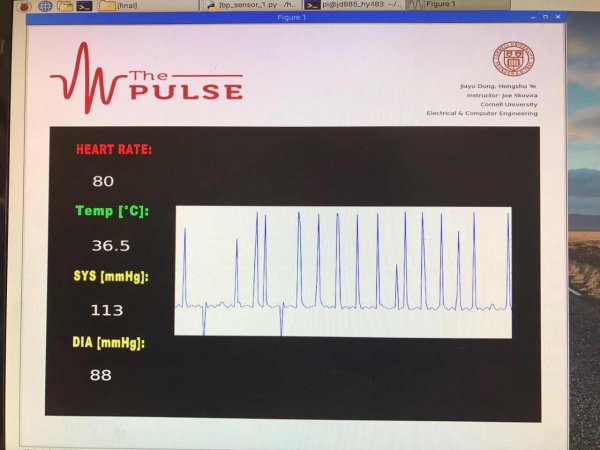
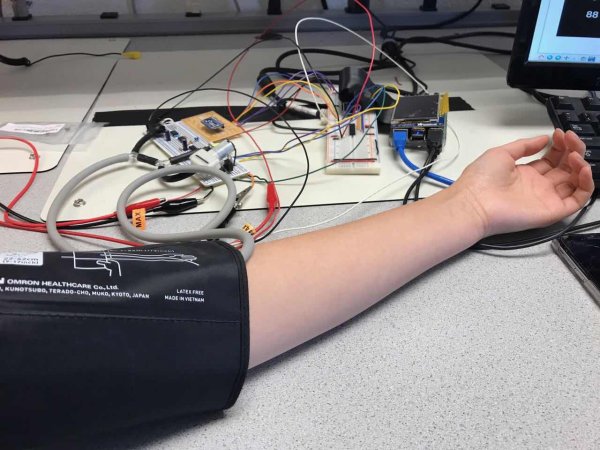
We implement a fully functional health monitor, which has the functions of body temperature, heart rate, blood pressure measurement, and GUI to display the measurement results. During testing stage, we compare the measurement results of OMERON product with our measurement data and calculated results. We find that our measurement results are really close to the results of OMERON. We achieve the high accuracy standard. The following figures and video show the health monitor.
Conclusions
Overall, our final project was accomplished successfully. We successfully implement the measurement of body temperature in Celsius degree, heart rate in bmp, and blood pressure in mmHg, and all of these three measurements are very accurate comparing with other digital measurement products we can buy from drugstore, supermarket, etc. Besides, we design a graphic user interface to display all the measurement results for users and also the electrocardiogram, which accurately restores the pressure data we get in measurement stage. We did several tradeoffs while we implement these functions to improve the data and calculation accuracy. We met several difficulties, and gradually solve all the problems and bugs. Through this project, we gained al lot of experience and learned a lot. All we learn and acquire from this project are valuable and precious for future studying in embedded operating system area.
Circuit Elements and Budgets
| Circuit Elements | Price |
|---|---|
| Resistors | $4 |
| Capacitorss | $2 |
| Temperature Sensor (TMP36) | $1 |
| Pressure Transducer(MPX2050GP) | $5 |
| ADC (MCP3008, ADS1115) | $5 |
| Handcuff | $10 |
| Opamps(LM324N, OPA2277) | $4 |
| Instrumentation Amplifier | $2 |
| Optocoupler(4N35) | $2 |
| NPN Bipolar Power Transistor (TIP31C) | $2 |
| Air Pump Motor | $3 |
| Air Valve | $2 |
| Total | $42 |
References
- Blood Pressure Measurement: “https://www.practicalclinicalskills.com/blood-pressure-measurement”
- TMP3602 Datasheet: “http://cdn.sparkfun.com/datasheets/Sensors/Temp/TMP35_36_37.pdf”
- MPX2050GP Datasheet: “http://www.nxp.com/assets/documents/data/en/data-sheets/MPX2050.pdf”