
Where I work, there is a very important room which houses lots of computers. The ambient temperature of this room has to be very cool to optimize performance of these systems.
I was asked to come up with a monitoring system which has the ability to send some form of alert to a few people that will notify them that something is wrong with the air conditioning in that room.
The hardware for this build, I used Raspberry pi and a USB temperature and humidity sensor. 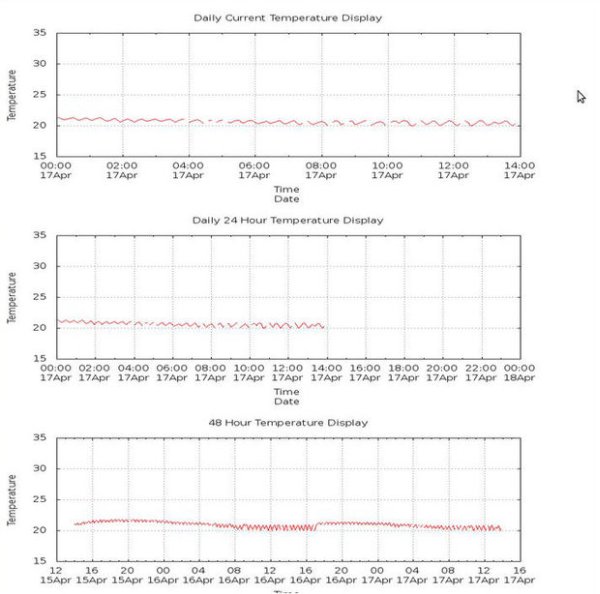
For monitoring, I used Gnuplot to plot three temperature graphs and create image of those graphs. I then created a dedicated HTML page that will be hosted on the Raspberry pi so the present conditions, those gnuplot output images, can be monitored from a web page within our network.
For alerting I opted to go with Gmail. I had found some example code in a Linux User magazine. (Of course you can use any mail server once you know the necesary port assignments. )
For that I created a dedicated Gmail email account for these alerts. Also as an added feature, when an alert has been triggered, I attach one graph to the email so the person receiving the email can get an idea of how drastic an increase it was that has caused the alert.
Step 1: The Hardware Setup
There isn't much to setting up the hardware. The Raspberry pi is running Raspian and the USB temperature sensor simply plugs directly into one of the USB ports.
The power consumption of this sensor is minimal and as a result I powered it directly from the Raspberry pi. However, for USB powered devices with a bit more power consumption, I would recommend powering them through a powered USB hub and not directly from the Raspberry pi's USB port.
Once the temperature sensor is powered, it provides a serial string which contains the temperature and humidity readings of the current conditions.
temperature=20.9°C humidity=62.7% dewpoint=13.0°C
A python script parses this string and stores the temperature and humidity values into three text files every five minutes; a daily, 24 hours and 48 hours text files (The differences will be discussed later in the HTML section). From these files, Gnuplot will generate the graphs and subsequently the images of the data set in each file.
Before I discuss the python script I will talk about preparing the Raspberry pi.
Since the monitoring is to be done online, a web server needs to be installed. I've tried a few of them in my time on the Raspberry pi but although it's a bit big I prefer Apache. To install Apache on your Raspberry pi you simply type:
sudo apt-get install apache2
It will give you a prompt before it installs, press “y” for yes and
and Apache will be installed a few minutes depending on your Raspberry pi.
Once that is done, you have to install two python plug-ins: python-serial and the python-gnuplot plug. (Although I have realised that recent Raspian builds has the python-serial plug-in standard but just to be safe.)
To install those you type:
sudo apt-get install python-serial python-gnuplot
Once again after acknowledging the prompts, these plug-ins will be installed.
And with that the hardware setup is complete.
Step 2: Software Setup – Email Setup and Recipients
create email addressBefore we get too far into the software now would be a good time to create a Gmail account to send your email alerts from. (This example uses GMail but any mail server can be used once our know the smtp port settings)
The python code is pretty straight forward but the imports needed are critical. Without them nothing would work.
from time import *
import time
import serial
import smtplib
import Gnuplot
import os
import sys
Finally, the mailing list. Of course we have to add the recipients of the email. Each email address is saved in a variable.
from_address = ‘[email protected]'
to_address1 = ‘recipient1.mail.com'
to_address2 = ‘recipient2.mail.com'
username = ‘custom_email@@gmail.com'
password = ‘custom_email_password'
Step 3: Software Setup – Serial setup and Parsing
Next we look at the serial setup.
It's just a matter of setting up parameters that matches the serial output from the sensor. The sensor outputs a serial string at 9600 8 N 1 which is a standard format.
After the string has been received there are several ways of parsing this string in python and quite possibly more reliably. The way I do it is to look for the “temp” characters in the serial string. Once located it is simply a matter of reading the next 46 serial characters into a string.
The collected string can now mbe addressed like elements in an array. The desired data is parsed out from the string and saved to the three files along with its corresponding time stamp.
timestamp = strftime(“%d%b%Y %H:%M:%S “,localtime())
Step 4: Software Setup – Gnuplot
Gnuplot is a command line graphical tool. Once you have figured out the basics it can be a pretty powerful tool for graphical display of data sets.
Gnuplot can plot directly from a formatted text file and we just so happen to have one from the parsing step before.
Once we indicate to gnuplot where in the file the data is located we can plot the desired values. I am going to use time on the X axis and our temperature on the Y axis.
Plotting time from my experience is the most difficult as you have to get the time format in gnuplot to match the format of the text file.
After all the graphing options are complete and to your preference, Gnuplot can then create an image os this graph. This will be the image that we will use on our Web page later. I opted to go with a .png image and since I want to replace the old image on the Web page, each image has the same name so this line of code doesn't have to change.
Image size setting is linked to html page optimization. I first played around with standard sizes then experimented to make the image fit my screen. For this project, I am not storing old images so the physical sized of the file in storage is not a major factor on precious Raspberry pi storage.
Here is a code snippet to create and store the daily.png graph image.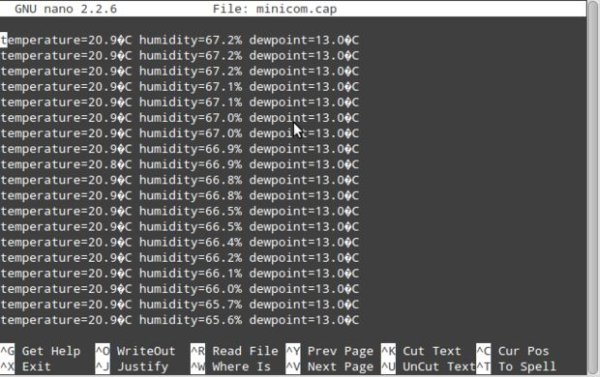
g = Gnuplot.Gnuplot(debug=debug)
g(‘cd “‘ + path + ‘”‘ )
g(‘set xdata time')
g(‘set timefmt “%d%b%Y %H:%M:%S”‘)
g(‘set format x “%H:%M\\n%d%b”‘)
g(‘set title ” Daily Current Temperature Display”‘)
g(‘set key off')
g(‘set grid') g(‘set xlabel “Time\\nDate”‘)
g(‘set yrange [15.0:35.0]')
g(‘set ylabel ” Temperature “‘)
g(‘set datafile missing “NaN”‘)
g(‘set terminal png size 800,400')
g(‘set output “daily.png”‘)
g(‘plot “daily.dat” using 1:($3) with lines')
NOTE: The line that reads g(‘set datafile missing “NaN”‘), the purpose of this line is to plot a blank space in the plot. The “NaN” variable is written to the file if the python script detects anything weird for a given reading or a serial transmission.
As you can see from the three graphs above, the daily.png gives you a current time display of the data whereas the 24_hour.png has the same information displayed on a 24 hour scale. The 48_hour.png graph shows your the last 48 hours worth of data from the sensor.
For more detail: Raspberry Pi controlled room temperature monitoring with Gnuplot image output and email alert ability