
This is a bandwidth monitor using a Raspberry Pi and an OLED display to graphically show the internet bandwidth into and out of our house.
A video showing it working is above.
Sometimes if the internet is slow or not working very well it can be hard to tell if it's because three other people are watching YouTube videos of if there's some other problem with the internet connection. By checking the bandwidth monitor you can see straight away the data rate into and out of the house and work out if the problem is with your internet connection or just too many people watching Mat and Pat on YouTube.
In a very brief summary it works as follows: The Raspberry Pi uses SNMP (Simple Network Management Protocol) to get the WAN data rates from the router and then displays these graphically on the OLED screen.
The Raspberry Pi was already set up as our media player and is next to the television. The OLED display was inexpensive and can be bought from a number of places including eBay.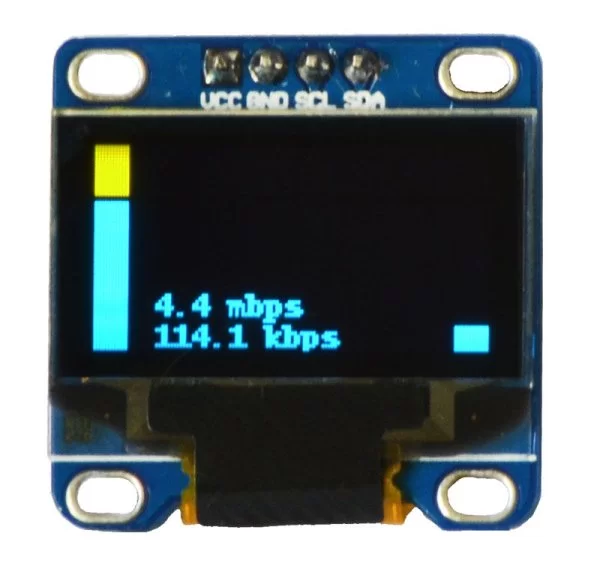
Step 1: Connect the OLED display to the Raspberry PI
This OLED display was purchased from eBay and cost around five dollars. It is a 128 x 64 pixel display. The top eight or so lines are a yellow colour and the rest of the display is blue. You could use a different sized or different coloured display although this could require modifying the code slightly. This display connects using i2c which makes things slightly simpler because it only requires four wires to connect.
To connect the pins on the display to the pins on the Raspberry Pi I used pre-made connector wires which can also be purchased inexpensively on eBay. These can be purchased in a few different types: They can either have a pin on each end and these are useful for making breadboard connections. They can have a pin on one end and a female plug on the other end or they can have a female plug on both ends. I bought a fair few of each type and they are very useful for connecting different types of boards and pin headers together. For this project I needed four wires with the female plug on each end.
I also had to cut out a hole in the top of my Raspberry Pi case to allow the wires to go through, but many cases already have an opening in the required location.
There are a number of guides which show how to connect an OLED display to a Raspberry Pi. The one that I followed was from Adafruit here: https://learn.adafruit.com/adafruit-oled-displays-for-raspberry-pi/introduction
After following this guide you should be able to run the demo Python script and see things appearing on your display. You will need to have this up and running before continuing with this instructable.
Step 2: Getting the bandwidth from the router
The first picture above shows the bandwidth information from our router. Basically the idea of this instructable is to show this bandwidth data from the WAN port of our router on the OLED display. To do this to Pi has to somehow get this information from the router.
I initially though that I'd have to have the Pi scrape this information from the routers web page but it turns out that it can be done much more efficiently using SNMP.
Hopefully your router supports SNMP or you're going to have to find an alternative way of doing this part. My router runs DD-WRT and accessing the information just required that SNMP be turned on from the Services page of the router.
We're going to do a bit of command line work now to check our access to the SNMP data from the router. If you have a Mac or Linux machine you can probably do this directly, otherwise you can SSH into the Raspberry Pi and issue the commands from there.
Install snmp using: sudo apt-get install snmp
Test snmp from your router using: ‘snmpwalk -v 1 -c public 192.168.0.1'
To explain this, snmpwalk will walk through all of the available snmp data and show it to you. ‘-v 1' means to use version 1 of the protocol. ‘-c public' means to show public information and ‘192.168.0.1' is the ip address of my router.
You can also use ‘snmpwalk -v 1 -c public 192.168.0.1 | less' if you need to show one page of information at a time. I had to do this to step through the pages of snmp values to find the number of the WAN connection.
From all of this information we just need to get the total byes in and the total bytes out from the port that we are interested in (the Raspberry Pi program will later subtract the previous total bytes from the current total bytes to work out the data rate each time it updates the screen). For my router this was using the oid (object identifier) ‘1.3.6.1.2.1.2.2.1.10.1' for the total inwards bytes on the WAN port and ‘1.3.6.1.2.1.2.2.1.16.1' for the total outwards bytes on the WAN port. If you're lucky these will be the same for your router otherwise you may have to do a bit of investigating to find out which specific oid's you will need.
Breaking this down a bit further the oid basically comes in two parts. The ‘1.3.6.1.2.1.2.2.1.10' part without the trailing ‘1' is for the total bytes in on an interface and the ‘1' at the end is the number for the interface. ‘1.3.6.1.2.1.2.2.1.16' is for the bytes out – with the same ‘1' for the same interface on the end.
You can see in the first picture above that the internal name for the WAN port is ppp0. Using snmpwalk as shown in the second picture you can deduce that the interface number for ppp0 is 1.
We can test this by issuing: snmpget -v 1 -c public 192.168.0.1 1.3.6.1.2.1.2.2.1.10.1
This will get just the snmp information for this oid. If you use the up arrow after each command you can issue this command a number of times and get an indication if this is the number that you are after which shows the total bytes on the required port.
Don't worry too much if you aren't certain if this is the correct oid, we can easily change this in code when running the bandwidth monitor program.
Armed with this we can use this information to write a Python script to display the bandwidth.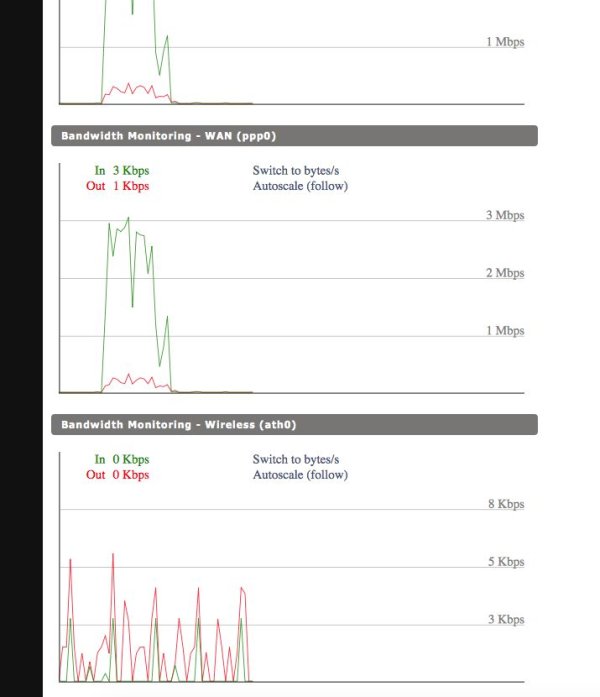
Step 3: Writing a Python script to show the bandwidth display
You will need a program called git to download the Python script to run this.
If you don't have git installed you can install it on the Pi using “sudo apt-get install git”
Go to a directory where you want to install this script. I used /home/osmc/python/bandwidth/ – you can put it anywhere you like.
Type in “git clone https://github.com/DarrenBeck/rpi-oled-bandwidth” to clone the project into your directory.
You should have a file in your directory called “net.py”. This is the Python script which will, if all goes well, display your network bandwidth on the display. You will probably need to change at least the router ip address, maximum data rates, and possibly the oid's used to extract the bandwidth data from the router.
To edit the file use “nano net.py”. Use Ctl-x to exit the editor.
To run the file use “sudo python net.py”. The program will show the bandwidth on the command line and if it is all working also show the graphical bandwidth on the OLED screen.
To explain a bit about how the program works.. This file is modified from the Adafruit example OLED code. Most of the first page is just initialisation for the screen and for the image buffer.
Next are a number of functions such as getSnmpInt and drawBar which are helpers for the program. Note that getSnmpInt converts the text like snmp response to an integer we can use. It does by using data.split() which by default will split the text on each space character into a list. data.pop() will return the last item from the list which was created by split and this is finally returned as an int type.
Next are some defines (there is no such thing as a define in Python so we just use variables).
Next it gets the total number of bytes sent through each interface. It does this at the start so that when it gets a new total it can work out how many bytes have been sent or received since the last time these were read. It also gets the time so that it can work out how much time has elapsed between each read and convert the totals into data rates such as kbps or mbps.
maxRateIn and maxRateOut are defines which are specific to our network connection and which will probably need to be adjusted for your network connection. I did this by running the program from the command line and seeing what are the highest rates for in and out traffic that the LAN port will ever get to. These are important as they set the maximum value that the bar graphs can rise to. If these are not set right your bar graphs will either be too short or extend off the screen. I picked numbers slightly higher than the maximum I ever saw.
The Adafruit code for drawing a rectangle had me stumped for quite a while. I am used to a rectangle draw function like draw.rectangle (x, y, width, height) but this one uses draw.rectangle (x, y, ending x, ending y).
Finally there is an infinite while loop which will calculate the data rates and display them on the screen each time. There is a delay of half a second in each loop but it also takes a little while for the program to send the new screen buffer over the i2c bus each time so the program ends up updating about once a second. It doesn't really matter how long it takes since we are also timing the loop.
Ideally I would have liked to use cron to start this program when the Pi starts but so far using osmc it isn't working. However I have another solution which works almost as well and the trick is to use a program called screen.
I use screen all of the time when ssh'ing into devices. It is worth the small amount of time it takes to learn how to use it. You can install it with ‘sudo apt-get install screen'. Basically screen lets you run a number of terminal screens from one terminal screen. Importantly is also allows you to run a terminal session on the PI and then detach from it and it will keep running on the Pi after you've closed your terminal connection.
The basic instructions for screen are: ‘screen' to start screen. ‘ctl-a c' to create a new screen. ‘ctl-a space' to switch between screens. ‘ctl-a d' to detach from all of your screens and ‘screen -r' to resume screens you've previously detached from.
Screen can also be used to communicate over a serial or usb stream, but that would be a whole other instructable.
So to run this script and keep it running the steps are;
screen
(navigate to folder where script is) sudo python net.py
ctl-a d (to detach – the script will keep running)
That should be everything you need to get a useful little bandwidth monitor up and running. I hope this works for you and look forward to any comments 🙂
This instructable could also be adapted to display the bandwidth data in other ways. Two rows of LED's or a different screen type could be an option if a larger display is required.