
A simple lane detection system I had developed a while back.
UPDATE: Version 2 of my Lane Detection System is up! Check out my Curved Lane Letector here!
Introduction
In any driving scenario, lane lines are an essential component of indicating traffic flow and where a vehicle should drive. It's also a good starting point when developing a self-driving car! In this project, I'll be showing you how to build your own lane detection system in OpenCV using Python. Here's the structure of our lane detection pipeline:
- Reading Images
- Color Filtering in HLS
- Region of Interest
- Canny Edge Detection
- Hough Line Detection
- Line Filtering & Averaging
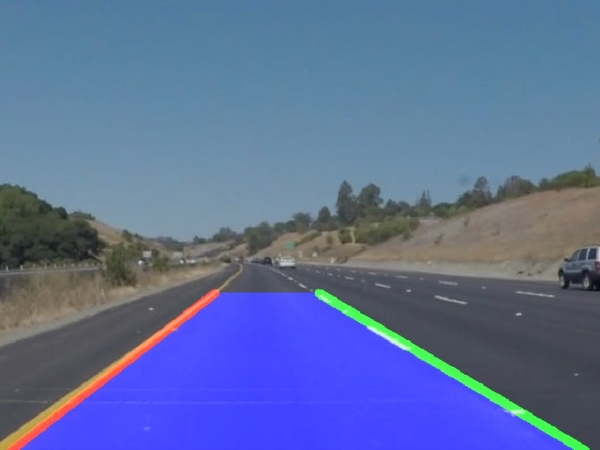
- Overlay detected lane
- Applying to Video
OpenCV
OpenCV is a very popular and well-documented library for computer vision. It's a great tool for any machine vision or computer vision application. If you haven't already installed it, check out the documentation and follow the installation tutorials.
Jupyter Notebooks
Ipython/Jupyter Notebooks are a fantastic tool for experimenting and testing code. You can quickly modify programs and run specific functions, making it really easy to develop a prototype. You can install Jupyter from your terminal using the following command:
pip install jupyter
1. Reading Images
When developing an image processing pipeline, you need to read some example inputs that you can test your pipeline on. You can read single images with the following method in OpenCV:
img = cv2.imread("imageDirectory.jpg")
Keep in mind it reads images in the BGR colorspace, and not the RGB colorspace. If you ever need to convert from one colorspace to another (BGR to RGB in this example), you can use the following method in OpenCV:
img = cv2.cvtColor(img, cv2.COLOR_BGR2RGB) # converts from BGR to RGB
However, we'll be using matplotlib in our program to read and display images, since it works very nicely with Jupyter environments. You can install matplotlib using:
pip install matplotlib
We'll be reading 6 different test images in a folder named test_images/. Here's our code to read the test images in that directory:
imageDir = 'test_images/'
imageFiles = os.listdir(imageDir)
imageList = [] #this list will contain all the test images
for i in range(0, len(imageFiles)):
    imageList.append(mpimg.imread(imageDir + imageFiles[i]))
and the following function to display our test images:
def display_images(images, cmap=None):
    plt.figure(figsize=(40,40))
    for i, image in enumerate(images):
        plt.subplot(3,2,i+1)
        plt.imshow(image, cmap)
        plt.autoscale(tight=True)
    plt.show()
when we call the function display_images with the input imageList, you should see this in your output cell:
display_images(imageList)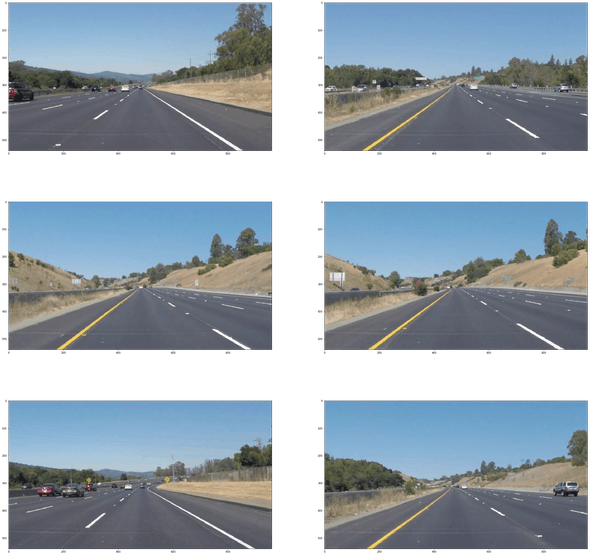
Now let's move on to the actual pipeline.
2. Color Filtering
Lane lines usually aren't colored green or blue or brown. They're generally colored white or yellow. We can filter out any unnecessary colors so that we can make sure our pipeline is processing only lane lines.
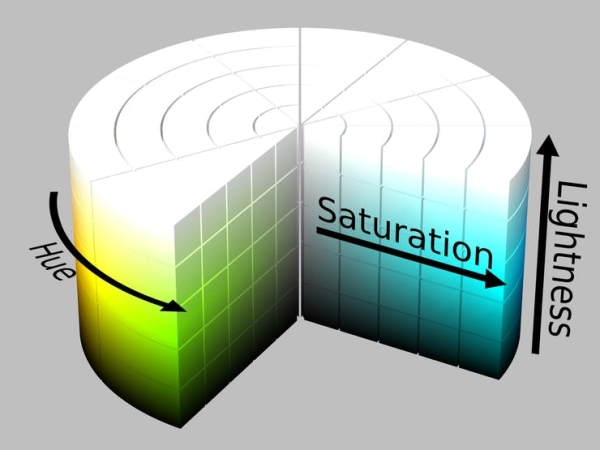
Color filtering in RGB or BGR colorspaces is unnecessarily difficult, however. We can use different colorspaces, or representations of color, to easily filter out extraneous colors. One such colorspace that makes color filtering really easy is the HLS colorspace, which stands for Hue, Lightness, and Saturation. Each pixel dimension's value is between 0-255.
We can convert images in the BGR colorspace to HLS like this:
hls = cv2.cvtColor(image, cv2.COLOR_RGB2HLS)
To get the yellow lane lines, we'll be getting rid of any pixels with a Hue value outside of 10 and 50 and a high Saturation value. To get the white lane lines, we'll be getting rid of any pixels that have a Lightness value that's less than 190.
We can then add the filtered yellow and white lane lines into a single image.
Here's the function to filter out the lane lines and output them:
def color_filter(image):
    #convert to HLS to mask based on HLS
    hls = cv2.cvtColor(image, cv2.COLOR_RGB2HLS)
    lower = np.array([0,190,0])
    upper = np.array([255,255,255])
    yellower = np.array([10,0,90])
    yelupper = np.array([50,255,255])
    yellowmask = cv2.inRange(hls, yellower, yelupper)
    whitemask = cv2.inRange(hls, lower, upper)
    mask = cv2.bitwise_or(yellowmask, whitemask)
    masked = cv2.bitwise_and(image, image, mask = mask)
    return masked
to apply this to a list of images, we can use the map() function:
filtered_img = list(map(color_filter, imageList))
When we display the images, you should see the following in your output cell:
display_images(filtered_img)Source: Simple Lane Detection