
INTRODUCTION :-
Monitoring vital signs and locations of certain classes of ambulatory patients can be useful in overcrowded emergency departments and at disaster scenes, both on-site and during transportation. To be useful, such monitoring needs to be portable and low cost, and have minimal adverse impact on emergency personnel, e.g., by not raising an excessive number of alarms. The SMART (Scalable Medical Alert Response Technology) system integrates wireless patient monitoring (ECG, SpO2), geo-positioning, signal processing, targeted alerting, and a wireless interface for caregivers. A prototype implementation of SMART was piloted in the waiting area of an emergency department and evaluated with 145 post-triage patients. System deployment aspects were also evaluated during a small-scale disaster-drill exercise.
Step 1: Getting parts
this are components to build this project:-
– e-Health Sensor Shield for Arduino and Raspberry Pi
– Pulse and oxygen in blood sensor (SPO2)
– Airflow sensor (breathing)
– Body temperature sensor
– Electrocardiogram sensor (ECG)
– Glucometer sensor
– Galvanic skin response sensor (GSR – sweating)
– Blood pressure sensor (sphygmomanometer) V2.0 New Sensor
– Patient position sensor (Accelerometer)
– Electromyography Sensor (EMG) New Sensor
– arduino or raspberry pi
– if you are using raspberry pi you need cooking hacks shield
– you need a Bluetooth or xbee shield or wifi shield
– you need app to interface your smart phone like i phone and Android phones
u can get the e-sensor shield and components (GET IT)
use either arduino or raspberry pi
Step 2: E-Health shield over Arduino or raspberry pi
picture 1 ,2 are the e-Health shield over Arduino
and reaming pictures are e-Health shield over raspberry pi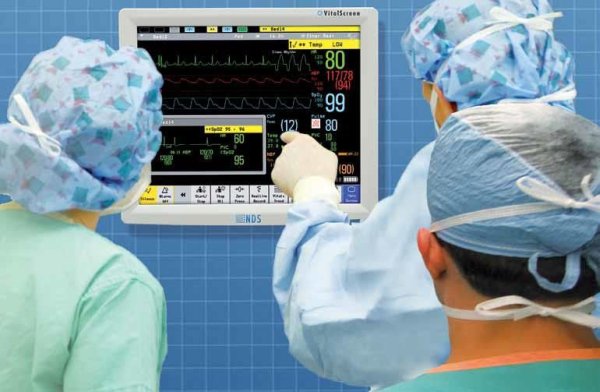
Step 3: The library
Note: these examples are written for Arduino 1.0.1. Certain functions may not work in other versions.
The e-health Sensor Platform counts with a C++ library that lets you read easily all the sensors and send the information by using any of the available radio interfaces. This library offers an simple-to-use open source system. In order to ensure the same code is compatible in both platforms (Arduino and Raspberry Pi) we use the ArduPi libraries which allows developers to use the same code
http://circuitsmaze.blogspot.in/
Using the library with Arduino:-
The eHealth sensor platform includes a high level library functions for a easy manage of the board. This zip includes all the files needed in two separated folders, “eHealth” and “PinChangeInt”. The “PinChangeInt” library is necessary only when you use the pulsioximeter sensor. Copy this folders in the arduino IDE folder “libraries”. Don't forget include these libraries in your codes.Download the e-Health library for Arduino
Libraries are often distributed as a ZIP file or folder. The name of the folder is the name of the library. Inside the folder will be the .cpp files, .h files and often a keywords.txt file, examples folder, and other files required by the library.
To install the library, first quit the Arduino application. Then uncompress the ZIP file containing the library. For installing eHealth library , uncompress eHealth.zip. It should contain a folder called “eHealth” and another called “PinChangeInt”, with files like eHealth.cpp and eHealth.h inside. Drag the eHealth and PinChange folders into this folder (your libraries folder). Under Windows, it will likely be called “My Documents\\Arduino\\libraries”. For Mac users, it will likely be called “Documents/Arduino/libraries”. On Linux, it will be the “libraries” folder in your sketchbook. The library won't work if you put the .cpp and .h files directly into the libraries folder or if they're nested in an extra folder. Restart the Arduino application. Make sure the new library appears in the Sketch->Import Library menu item of the software. That's it! You've installed a library!
Using the library with Raspberry Pi:-
The e-Health library for Raspberry Pi requires the arduPi library and both libraries should be in the same path.
Download the e-Health Libraries for Raspberry
Creating a program that uses the library is as simple as putting your code in this template where it says “your arduino code here”
//Include eHealth library (it includes arduPi)
#include “eHealth.h”
/********************************************************
* * IF YOUR ARDUINO CODE HAS OTHER FUNCTIONS APART FROM*
* *setup() AND loop() YOU MUST DECLARE THEM HERE *
* ******************************************************/
/**************************
* YOUR ARDUINO CODE HERE *
* ************************/
int main (){
setup();
while(1){
loop();
} return (0);
}
Compilation of the program can be done in two ways:
Compiling separately eHealth and arduPi, and using them for compiling the program in a second step:
g++ -c arduPi.cpp -o arduPi.o
g++ -c eHealth.cpp -o eHealth.o
g++ -lpthread -lrt user-e-health-app.cpp arduPi.o eHealth.o -o user-e-health-app
Compiling everithing in one step:
g++ -lpthread -lrt user-e-health-app.cpp arduPi.cpp eHealth.cpp -o user-e-health-app
Executing your program is as simple as doing:
sudo ./user-e-health-app
Step 4: Sensor Platform(testing each sensor)
Pulse and Oxygen in Blood (SPO2)
SPO2 sensor features Pulse oximetry a noninvasive method of indicating the arterial oxygen saturation of functional hemoglobin.Oxygen saturation is defined as the measurement of the amount of oxygen dissolved in blood, based on the detection of Hemoglobin and Deoxyhemoglobin. Two different light wavelengths are used to measure the actual difference in the absorption spectra of HbO2 and Hb. The bloodstream is affected by the concentration of HbO2 and Hb, and their absorption coefficients are measured using two wavelengths 660 nm (red light spectra) and 940 nm (infrared light spectra). Deoxygenated and oxygenated hemoglobin absorb different wavelengths.
Deoxygenated hemoglobin (Hb) has a higher absorption at 660 nm and oxygenated hemoglobin (HbO2) has a higher absorption at 940 nm . Then a photo-detector perceives the non-absorbed light from the LEDs to calculate the arterial oxygen saturation.
A pulse oximeter sensor is useful in any setting where a patient's oxygenation is unstable, including intensive care, operating, recovery, emergency and hospital ward settings, pilots in unpressurized aircraft, for assessment of any patient's oxygenation, and determining the effectiveness of or need for supplemental oxygen. Acceptable normal ranges for patients are from 95 to 99 percent, those with a hypoxic drive problem would expect values to be between 88 to 94 percent, values of 100 percent can indicate carbon monoxide poisoning. The sensor needs to be connected to the Arduino or Raspberry Pi, and don't use external/internal battery.
Connecting the sensor:-
Connect the module in the e-Health sensor platform. The sensor have only one way of connection to prevent errors and make the connection easier.
PICTURE 1:-
connecting to the e-Health shield with Pulse and Oxygen in Blood (SPO2)
PICTURE 2:-
Insert your finger into the sensor and press ON button.
AND NOW THE TEST THE SPO2 IT IS WORKING OR NOT
THIS IS THE CODE LINK:(GET HEAR)
PICTURE 3:-
Upload the code to Arduino and watch the Serial monitor.Here is the USB output using the Arduino IDE serial port terminal
Raspberry Pi code:
TESTING CODE RASPBERRY PI GET HEAR
Step 5:
(TESTING)Electrocardiogram (ECG):-
ECG sensor features The electrocardiogram (ECG or EKG) is a diagnostic tool that is routinely used to assess the electrical and muscular functions of the hear. The Electrocardiogram Sensor (ECG) has grown to be one of the most commonly used medical tests in modern medicine. Its utility in the diagnosis of a myriad of cardiac pathologies ranging from myocardial ischemia and infarction to syncope and palpitations has been invaluable to clinicians for decades.
The accuracy of the ECG depends on the condition being tested. A heart problem may not always show up on the ECG. Some heart conditions never produce any specific ECG changes. ECG leads are attached to the body while the patient lies flat on a bed or table. What is measured or can be detected on the ECG (EKG)? The orientation of the heart (how it is placed) in the chest cavity. Evidence of increased thickness (hypertrophy) of the heart muscle. Evidence of damage to the various parts of the heart muscle. Evidence of acutely impaired blood flow to the heart muscle. Patterns of abnormal electric activity that may predispose the patient to abnormal cardiac rhythm disturbances. The underlying rate and rhythm mechanism of the heart
PICTURE 4:-
Schematic representation of normal ECG Connecting the sensor:-
PICTURE 5,6:-
Connect the three leads (positive, negative and neutral) in the e-Health board.
PICTURE 7:-
Connect the ECG lead to the electrodes.
PICTURE 8:-
Remove the protective plastic
PICTURE 9,10:-
Place the electrodes as shown below
TESTING CODE FOR ARDUINO GET HEAR
TESTING CODE FOR RASPBERRY PIGET HEAR
Step 6:
(TESTING)Airflow: breathing:-
Anormal respiratory rates and changes in respiratory rate are a broad indicator of major physiological instability, and in many cases, respiratory rate is one of the earliest indicators of this instability. Therefore, it is critical to monitor respiratory rate as an indicator of patient status. AirFlow sensor can provide an early warning of hypoxemia and apnea. The nasal / mouth airflow sensor is a device used to measure the breathing rate in a patient in need of respiratory help or person. This device consists of a flexible thread which fits behind the ears, and a set of two prongs which are placed in the nostrils.
Breathing is measured by these prongs. The specifically designed cannula/holder allows the thermocouple sensor to be placed in the optimal position to accurately sense the oral/nasal thermal airflow changes as well as the nasal temperature air. Comfortable adjustable and easy to install.
PICTURE 11:–
Comfortable adjustable and easy to install.
Connecting the sensor:-
The e-Health AirFlow sensor have two connections (positive and negative)
PICTURE 12,13:-
Connect the red wire with the positive terminal (marked as “+” in the board) and the black wire with the negative terminal (marked as “-” in the board).
TESTING CODE FOR ARDUINO GET HEAR
TESTING CODE FOR THE RASPBERRY PI(GET HEAR)
PICTURE 14:-
Upload the code and watch the Serial monitor.Here is the USB output using the Arduino IDE serial port terminal
Step 7:
(TESTING)Body temperature:-
Temperature sensor features Body temperature depends upon the place in the body at which the measurement is made, and the time of day and level of activity of the person. Different parts of the body have different temperatures. The commonly accepted average core body temperature (taken internally) is 37.0°C (98.6°F). In healthy adults, body temperature fluctuates about 0.5°C (0.9°F) throughout the day, with lower temperatures in the morning and higher temperatures in the late afternoon and evening, as the body's needs and activities change. It is of great medical importance to measure body temperature.
The reason is that a number of diseases are accompanied by characteristic changes in body temperature. Likewise, the course of certain diseases can be monitored by measuring body temperature, and the efficiency of a treatment initiated can be evaluated by the physician.
Hypothermia<35.0 °C (95.0 °F)
Normal 36.5–37.5 °C (97.7–99.5 °F)
Fever or Hyperthermia>37.5–38.3 °C (99.5–100.9 °F)
Hyperpyrexia>40.0–41.5 °C (104–106.7 °F)
PICTURE 15:-
For taking measures of temperature, connect the sensor in the jack connector using the adapter
PICTURE 16,17:-
Make contact between the metallic part and your skin Use a piece of adhesive tape to hold the sensor attached to the skin
TESTING CODE FOR ARDUINO :GET HEAR
PICTURE 18:- Upload the code and watch the Serial monitor. Here is the USB output using the Arduino IDE serial port terminal
TESTING CODE FOR RASPBERRY PI GET HEAR
Step 8:
(TESTING)Blood pressure:-
Blood pressure sensor features Blood pressure is the pressure of the blood in the arteries as it is pumped around the body by the heart. When your heart beats, it contracts and pushes blood through the arteries to the rest of your body. This force creates pressure on the arteries. Blood pressure is recorded as two numbers—the systolic pressure (as the heart beats) over the diastolic pressure (as the heart relaxes between beats).
Monitoring blood pressure at home is important for many people, especially if you have high blood pressure. Blood pressure does not stay the same all the time. It changes to meet your body’s needs. It is affected by various factors including body position, breathing or emotional state, exercise and sleep. It is best to measure blood pressure when you are relaxed and sitting or lying down.
Classification of blood pressure for adults (18 years and older)
| Systolic (mm Hg) | Diastolic (mm Hg)
Hypotension | < 90 | < 60
Desired | 90–119 | 60–79
Prehyper – | 120–139 | 80–89
tension | |
Stage 1 | 140–159 | 90–99
Hypertension | |
Stage 2 | 160–179 | 100–109
Hypertension | |
Hypertensive | ≥ 180 | ≥ 110
Crisis | |
High blood pressure (hypertension) can lead to serious problems like heart attack, stroke or kidney disease. High blood pressure usually does not have any symptoms, so you need to have your blood pressure checked regularly. The sensor needs to be connected to the Arduino and use internal battery (2X3A)
Connecting the sensor:-
The first thing we are going to do with the module is to connect the jumpers in right position. In this case, jumpers have to be set on SPHY gateway position.
PICTURE 19:-
Connect the jack cable with the sphygmomanometer and the e-Health board.
PICTURE 20,21-
Place the sphygmomanometer on your wrist as shown in the image below. Palm up and the rigth side of the blood-pressure meter up, wrap the cuff around the left wrist from 5-10mm (about a pinky finger width).
PICTURE 22:-
To correct measure is important to maintain the heart and the wrist in the horizontal plane.
Press On/Off button and wait while the sphygmomanometer is taking the measure.
After a few seconds the result is shown in the sphygmomanometer screen and in the Arduino serial monitor. The measure is taken independently by the Arduino/RasberryPi, and may not match exactly, but the values should be very similar. Do not make abrupt movements or the measure will be not reliable.
GET THE ARDUINO CODE HEAR FOR TESTING BP SENSOR GET HEAR
PICTURE 23:-
Upload the code and watch the Serial monitor.Here is the USB output using the Arduino IDE serial port terminal:
GET THE RASPBERRY PI CODE FOR TESTING BP SENSORGET HEAR
Step 9:
Patient position and falls:-
Position sensor features The Patient Position Sensor (Accelerometer) monitors five different patient positions (standing/sitting, supine, prone, left and right.) In many cases, it is necessary to monitor the body positions and movements made because of their relationships to particular diseases (i.e., sleep apnea and restless legs syndrome).
Analyzing movements during sleep also helps in determining sleep quality and irregular sleeping patterns. The body position sensor could help also to detect fainting or falling of elderly people or persons with disabilities.
eHealth Body Position Sensor uses a triple axis accelerometer to obtain the patient's position.
Features: 1.95 V to 3.6 V supply voltage
1.6 V to 3.6 V interface voltage
±2g/±4g/±8g dynamically selectable full-scale
This accelerometer is packed with embedded functions with flexible user programmable options, configurable to two interrupt pins.The accelerometer has user selectable full scales of ±2g/±4g/±8g with high pass filtered data as well as non filtered data available real-time.
PICTURE 24:-
body positions
Connecting the sensor:-
PICTURE 25,26:-
The body position sensor has only one and simple way of connection. Connect the ribbon cable with the body position sensor and the e-Health board as show in the image below.
PICTURE 27:-
Place the tape around the chest and the connector placed down
ARDUINO CODE FOR TESTING PATIENT POSITION SENSORGET HEAR
PICTURE 28:-
Upload the code and watch the Serial monitor.Here is the USB output using the Arduino IDE serial port terminal:
RASPBERRY PI CODE FOR TESTING PATIENT POSITION SENSOR GET HEAR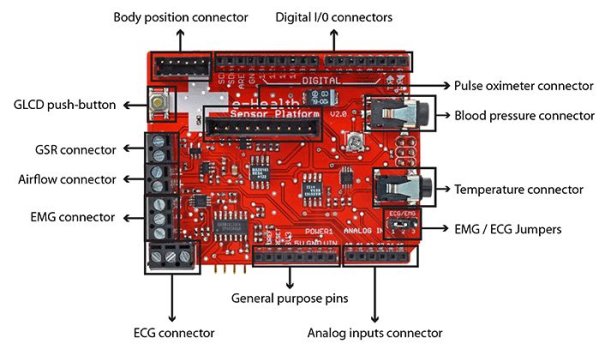
Step 10:
Galvanic Skin Response (GSR):-
GSR sensor features Skin conductance, also known as galvanic skin response (GSR) is a method of measuring the electrical conductance of the skin, which varies with its moisture level. This is of interest because the sweat glands are controlled by the sympathetic nervous system, so moments of strong emotion, change the electrical resistance of the skin. Skin conductance is used as an indication of psychological or physiological arousal, The Galvanic Skin Response Sensor (GSR – Sweating) measures the electrical conductance between 2 points, and is essentially a type of ohmmeter.
In skin conductance response method, conductivity of skin is measured at fingers of the palm. The principle or theory behind functioning of galvanic response sensor is to measure electrical skin resistance based on sweat produced by the body. When high level of sweating takes place, the electrical skin resistance drops down. A dryer skin records much higher resistance. The skin conductance response sensor measures the psycho galvanic reflex of the body. Emotions such as excitement, stress, shock, etc. can result in the fluctuation of skin conductivity. Skin conductance measurement is one component of polygraph devices and is used in scientific research of emotional or physiological arousal.
Connecting the sensor:-
PICTURE 29,30:-
Connect the to wires in the GSR contacts. The contacts have not polarization.
PICTURE 31,32:-
The galvanic skin sensor has two contacts and it works like a ohmmeter measuring the resistance of the materials. Place your fingers in the metallic contacts and tighten the velcro as shown in the image below.
GET THE ARDUINO CODE FOR TESING GSR GET HEAR
PICTURE 33:-
Upload the code to Arduino and watch the Serial monitor.
Here is the USB output using the Arduino IDE serial port terminal:
GET THE RASPBERRY PI FOR TESTING GSRGET HEAR