
Introduction
Every lab (home, office, school) needs temperature measurement capabilities. Measuring temperature for science experiments is hard – all sorts of materials, liquids, and chemicals may be involved or a large temperature range may need to be covered. The sensor used for this (a thermocouple) is not easy to interface, and the sensor amplifier is non-trivial since it has to be able to measure an extremely small voltage.
For flexibility in the science experiments that it can be used for, high accuracy is needed along with a fast response and good update rate. It goes without saying that data should be logged in a convenient form, and it should be easy to use.
For convenience there are ready-built temperature measurement and logging products out there, sometimes they are not easy to use due to soft-button overload and a limited display. In addition for large lab or classroom use information should be logged and retrievable by people easily – and perhaps view the current status on a large screen. It also goes without saying that some experiments may take a long time, so the ability to check up on your experiment using a mobile phone during lunch is useful too. One last requirement was that this should be easy to build even for people new to electronics and software.
This project shows how to connect up a thermocouple board to a Raspberry Pi (RPI), and use it for temperature measurement and logging with great performance and ultra-low cost. This project is easy – no soldering required unless you want to. This is also a great project to start using the ‘DIL (dual-in-line) header' connector on the RPI if you have not already done so.
Design Overview
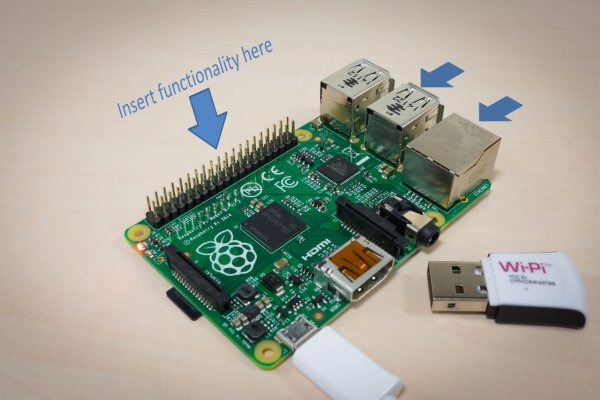
A lot of thermocouple-based hobbyist projects use the MAX31855 integrated circuit and ready-built ‘thermocouple amplifier’ boards are available for connecting to the RPI from several suppliers. This project however uses the far higher-resolution ADS1118 from Texas Instruments. It comes in a surface-mount package but fortunately a ready-built ADS1118 development board is available which contains all circuitry including a LCD display and thermocouple – it is extremely good value for money. If you don’t fancy soldering then it is possible to connect up this board to the Raspberry Pi (or any other computer board – it uses a standards based communicaton method called Serial Peripheral Interface or SPI) using eight jumper wires (male-to-female cables are needed). Alternatively, if you don’t mind a soldering exercise then a small adapter board can be constructed. This was the approach taken here. In summary you can see in the photo below all the bits that are used for this project, including the assembled adapter board.
The entire project can be controlled via a web browser or from the command line.
To build the adapter board, the simplest way is to use a circuit board; using EAGLE software I drew up a design for which the files are attached to this post ready to send off to a PCB manufacturer (it costs about $30 for ten boards).
Alternatively, prototyping board can be used; I obtained some perf-board (the type with isolated pads, not stripboard) and cut it to size. A 3mm hole was drilled for attaching a support pillar (threaded hex spacer). The boards are next to each other, not on top of each other, to minimise temperature change and noise issues, both of which would have an effect on the thermocouple reading.
I wanted the ability to plug in the ADS1118 board onto the pad side of the perf-board, so there is a slight complication here. The solution was to use bent SIL headers. 10-way SIL headers are needed (the photo shows 8-way which is what I had at hand) – or use surface mount ones which are similar but with the bent ends alternating on either side. If you are using a circuit board and not perf-board, then straight SIL headers are needed.
To get them aligned, plug them into the ADS1118 board, and position it over the perf-board and then tack a few pins with solder. Then the ADS board can be very gently unplugged and the SIL headers can then be soldered properly. Note that at this stage it is quite difficult to unplug without tearing the pads off the board. Hold the bent part of the SIL headers against the board while unplugging the ADS1118 board.
Next, to make the SIL headers very secure, solder each pin to as many pads as possible (each one can be soldered to three pads).
To identify the connections, refer to the pin numbering photo below and the following table:
- * Connections:
- * TI board RPI B+
- * ———— ——————
- * P1_1 VCC 1 3.3V
- * P1_7 CLK 23 CLK
- * P1_8 ADS_CS 26 SPI_CE1
- * P2_8 LCD_CS 24 SPI_CE0
- * P2_9 LCD_RS 11 GPIO_17_GEN0
- * P2_1 GND 9 GND
- * P2_6 SIMO 19 MOSI
- * P2_7 SOMI 21 MISO
After testing the software and board functionality, it is possible to use some epoxy resin glue (e.g. Araldite) to make the SIL headers even more secure. A minimal amount was used so that it was possible to still just-about solder onto the pins if needed to in future.
With the PCB approach mentioned earlier, when the PCB arrives, the header pins and receptacle can be soldered, and it is an easy task (takes five minutes) so the PCB is the preferred method especially if you need to make many of them (I intend to make several). I used DIL header pins instead of SIL, but either will work with the PCB layout attached to this post.
Software
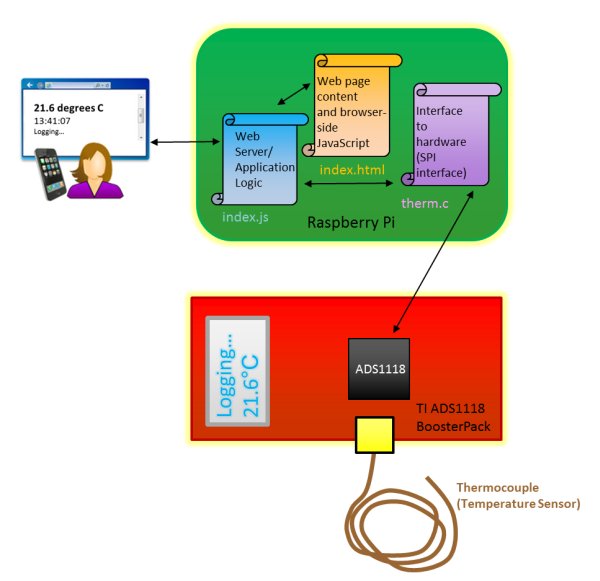
The diagram here shows the entire solution overview. The majority of the code is in three files. The code that interfaces to the ADS1118 board is discussed first, because it is possible to run this code standalone if desired. It is shown in purple in the diagram.
To create the software, the first thing one of the things to do is to create a logo:
- /**********************************************************************************************
- * therm.c
- * RPI <-> 430BOOST-ADS1118 Thermocouple/LCD Board
- *
- * __ __ ____ _____
- * ____ | | ____ _____ ____ _____/ |_ /_ | / | |
- * _/ __ \| | _/ __ \ / \_/ __ \ / \ __\ | |/ | |_
- * \ ___/| |_\ ___/| Y Y \ ___/| | \ | | / ^ /
- * \___ >____/\___ >__|_| /\___ >___| /__| |___\____ |
- * \/ \/ \/ \/ \/ |__|
- *
The next step is to make use of the wealth of code that TI usually offers. In this case, TI already had high quality ADS1118 code intended for the MSP430 Launchpad that could be reused. It was adapted slightly to be usable on the RPI, using some input/output (I/O) code from Gert van Loo and Dom.
Temperature measurement may seem to be an easy task (read an ADC value and convert to temperature) but thermocouples require ‘cold junction compensation’ which in the case of the ADS1118 means reading an internal temperature sensor too. The code interleaves reading the internal sensor and the external thermocouple. Another key point is that a thermocouple output is not linear compared to temperature; thermocouple manufacturers publish data that can be used to get a more accurate conversion from ADC value to actual temperature. The TI code already includes these capabilities for the supplied thermocouple.
The code was adapted to add logging capability. Since the board is to be powered by the noisy 3.3V supply from the RPI, and it is in close proximity to the RPI, some steps need to be taken to ensure that the measurement is cleaned up. The implemented algorithm every second reads the internal temperature sensor once, and the external thermocouple ten times in a short burst (a few hundred milliseconds total) so that the measurements can be averaged and finally output to 0.1 degrees C resolution. The end result was very good; see some example output here.
The LCD has two lines of 16 characters, so it was decided to use the bottom line to display the time and current thermocouple temperature. The top line is user-dependent; it can be set to something so that people immediately know what the experiment is about. For example, it can say “Test #1” or “Don’t touch’.
Using the code is easy.
 First off, confirm that some features are enabled on the RPI. If the RPI is being used fresh, then after operating system installation, ensure that the ‘Advanced’ menu option is selected and then enable three things: SSH, SPI and I2C – we don't use all these for this project, but they are standards based interfaces that should always be enabled unless you never want to unplug the RPI from a monitor or not make use of the 40-way DIL connector on the RPI. If this was not done after OS install, then type raspi-config in a text window (also known as a command shell) on the RPI and then select ‘Advanced’ in the menu that appears.
Assuming the three features mentioned above are enabled, then create a folder for your work off your home directory (e.g. create a folder called development and then a sub-folder called therm) and copy the source code (attached to this post) into that sub-folder.
To compile the code type:
- gcc -o therm therm.c -lrt
The code is now ready to run. There are a few ways to use this project. One way is to just type commands into the command shell. Another way is to use a web browser. These two methods are discussed next.
Command Interface
The code can be run either using ‘sudo’ or as superuser (root) user.
For the latter, to become root user, first type sudo passwd root one time, and create a superuser (i.e. root user) password. Now, whenever you want to become superuser, you can just type ‘su‘ and enter that password. To exit out of superuser privileges at any time, type ‘exit‘. Some people prefer sudo, others feel it is an unnecessary handcuff.
For more detail: Temperature Measurement for Lab and Science Projects