
Several months ago, I was determined to build the bandwidth monitor posted by Legufix here on Instructables (instructables.com/Bandwidth-Monitor). I ordered the Raspberry Pi Zero and gathered other materials, but I wondered if I could just use the 7″ Raspberry Pi touchscreen that I had left over from another project. It would require a few changes to the code, but not much I was certain. So I dived in and began developing my own version.
I wanted this to do what Legufix had done – to cycle power to the ISP modem when the monitor detected that the internet service was down, but I also wanted it to visually take advantage of the large touchscreen. I hadn't done much Python programming, so I began researching and planning.
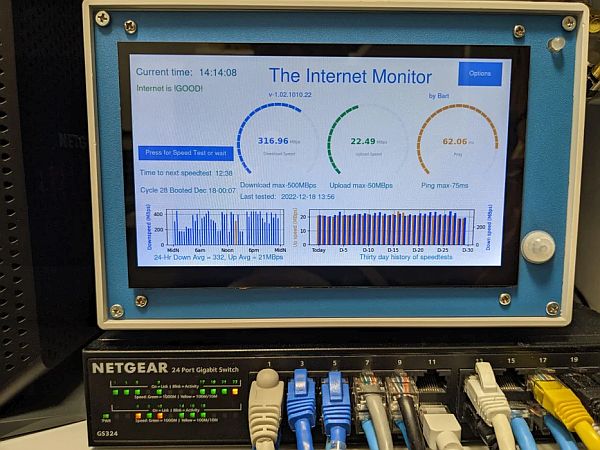
Now, almost 1200 lines of Python code later, the project is ready. It looks different, acts different, but underlying the surface are some key things that Legufix included in his project:
- Displayed download speed and upload speed, plus ping time to the speedtest server
- Automatic detection of ISP internet drop and cycle power to modem
- Option to run speedtest out of normal 30 minute cycle of tests
- Option to upload speedtest data to Ubidots for historical data logging and collection
- An LED indicator for various processing states
I found some cool gauges that I could use to display the speed times, but I still had screen real estate, so I developed a way to show historical 24-hour and 30-day bar charts of the speedtest results. Now, I could see how the speedtests changed during the 24-hour day period (typically slower in the evenings as people begin watching internet activities after work and school). Plus, I had some good data on the ISP performance over a 30 day period. I also needed to cycle power to the router after the modem was reset. And since I was using a touchscreen instead of an e-Ink screen, the software had to keep the screen updated and run all the time. So, now it includes the following additional features:
- Touchscreen with touch controls for out-of-cycle speedtests and for configuration changes
- 24-hr history chart of download speeds
- 30-day history chart of download speeds and ping times to server
- Power cycling for modem and router
- Separate power supply for monitor power
- Logging of program performance data options
- Database of speedtest results and key parameters
And, finally, I found a cool case that I could install all of this in so that it would look nice with my modem, router, and gigabit switch.
Supplies
- Fielect Electronic Enclosure Project Box (https://www.amazon.com/gp/product/B07ZT9KFBV/ref=ppx_yo_dt_b_search_asin_title?ie=UTF8&psc=1)
- Raspberry Pi 4 (Could use Pi 3, but I found the zero to be too slow) or equivalent
- Raspberry Pi touchscreen monitor (I used a 7″ from eBay – https://www.ebay.com/itm/154177051314)
- DC-DC converter (for converting 12vDC to 5vDC for the processor) (https://www.amazon.com/gp/product/B07D4D4Z75/ref=ppx_yo_dt_b_search_asin_title?ie=UTF8&psc=1)
- RGB LED and 220 ohm resistors (https://www.amazon.com/gp/product/B077XGF3YR/ref=ppx_yo_dt_b_search_asin_title?ie=UTF8&psc=1)
- Power switch (qty 2) Can be this or similar (https://www.amazon.com/mxuteuk-Household-Appliances-Warranty-KCD1-1-101/dp/B07QS9L2S1/ref=sr_1_2_sspa?crid=100LLG8X3BO1T&keywords=uxcell%2Bac%2B250v%2Brocker%2Bswitch&qid=1671388364&sprefix=uxcell%2Bac%2B250v%2Brocker%2Bswitch%2Caps%2C95&sr=8-2-spons&spLa=ZW5jcnlwdGVkUXVhbGlmaWVyPUEyU0FCOTZVN0QzVFFMJmVuY3J5cHRlZElkPUEwMjU4Mzg3MTQ3UTNSUFdPVloyVCZlbmNyeXB0ZWRBZElkPUEwOTI3NTYxM0JaS0gyUlRHSFY0OCZ3aWRnZXROYW1lPXNwX2F0ZiZhY3Rpb249Y2xpY2tSZWRpcmVjdCZkb05vdExvZ0NsaWNrPXRydWU&th=1)
- 5v 2 channel Relay module (https://www.amazon.com/gp/product/B078478SZ9/ref=ppx_yo_dt_b_search_asin_title?ie=UTF8&psc=1> )
- Male and Female power connectors (one for primary power 12vDC, one for modem power, and one for router power – you'll have to determine what works for your router and order both male and female)
- Computer fan (12v) (https://www.amazon.com/gp/product/B08R9JNB2Y/ref=ppx_yo_dt_b_search_asin_title?ie=UTF8&psc=1)
- DC Buck Converter for Fan control (https://www.amazon.com/gp/product/B08R9JNB2Y/ref=ppx_yo_dt_b_search_asin_title?ie=UTF8&psc=1)
- USB cables for screen to Raspberry Pi and for a panel USB connector for a USB keyboard
- HDMI cable for screen to Raspberry Pi (may require right angle adapter also)
- Ethernet panel jack with cable (https://www.amazon.com/gp/product/B07V8G8DF2/ref=ppx_yo_dt_b_search_asin_title?ie=UTF8&psc=1)
- USB Keyboard (optional)
- Supply of small screws, washers, and nuts
- Standoffs to hold the Raspberry Pi and relay boards (Amazon – LitOrange 320PCS M3 Male Female Nylon Hex Spacer Standoff Screw Nut Threaded Pillar PCB Motherboard Assorted Assortment Kit (or similar nylon standoff)
- 12v DC Power Supply (I used one that I had spare from former project. You'll need a 2A or larger)
- Solder seal connectors for RGB LED resistors (170PCS Solder Seal Wire Connector Kit, Qibaok Heat Shrink Butt Terminal Waterproof Insulated Electrical Butt Splice for Automotive Marine Boat Truck )
Step 1: Preparing the Case
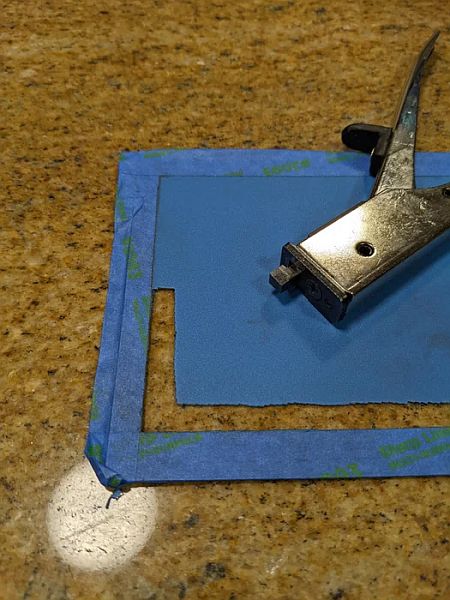
The first case I used was home-built from materials I had available. It worked fine and served well to test out the new system, but it didn't look very cool. The new case solved that problem and I found it easy to work with. You'll need to cut out a substantial part of the front panel for the screen and drill or cut holes in the rear panel for the cable connections and switches.
Start by laying out exactly where you want the screen. If you use a smaller screen (5″), then you'll have more room on the front panel for connections, such as the panel USB for keyboard or memory sticks. If you use the 7″ display, you'll not have much room for anything else except the multi-color LED. Be mindful of the connections for the screen – from the rear, my screen had all connections on the left side, which meant I needed to push the screen to the right as far as possible. Measure it all before you begin cutting and be sure to take into account the braces within the case.
Tools:
- Small power drill and various drill bits
- Sheet-metal nibbler ( I used a hand-held one) to cut out the opening for the screen, switches, and other parts
- Screwdrivers
Once the openings are laid out you'll need to drill a hole to start the nibbling from. Make this first opening somewhere near the edge, but not on the cutting line, just to ensure your drill doesn't bite part of the edge. Then use the nibbler to carefully cut along the cutting lines (I used painters tape to form a more defined cutting line). DO NOT cut the hole for the RBG LED yet. You'll want to fit the screen to the panel and determine where connections go first.
Do the same for the rear panel switches and power connectors.
Once you cut all the panel openings, use a small file to smooth the cut edges. Test fit the components. They should easily fit into the openings. If not, file and test fit again until all components mount easily.
For the screen – if you are using the same 7-inch touchscreen that I used, you will find it a tight fit top to bottom inside the case plastic frame. I had to notch a couple of places out of the frame where screws were used to mount the screen to the metal front. Also, I had to use an HDMI right angle connector to provide space for the HDMI cable to connect.
Step 2: Mounting the Components
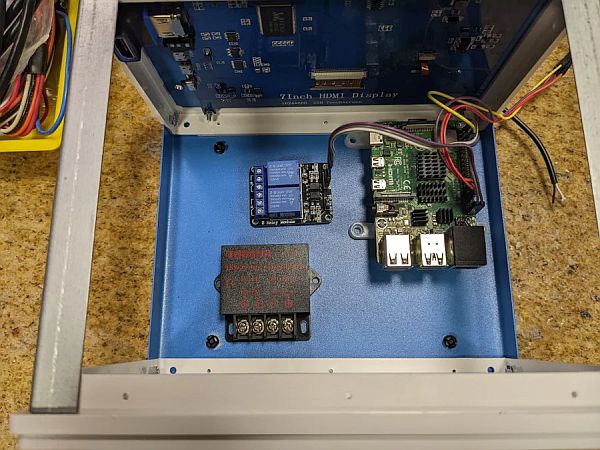
Before mounting any other component, determine the best place for the Raspberry Pi. It will have several connections to the touchscreen (HDMI, power, touch), and connections to the power converter and switches. It will also have connections to the relays. I found the best place for me was on the right side (front panel straight ahead, looking down from top of enclosure). This gave my USB cables ample room to connect and left space for the power converter and relay modules to be secured to the bottom of the enclosure.
I strongly recommend testing out all components connected together on your lab bench before installing them into the enclosure. It gets kind of crowded in there with all the cables and such.
Once you are sure where everything will go, use the standoffs to mount the Raspberry Pi board and the relay module to the enclosure. The power converter can be mounted directly to the bottom plate.
I mounted the fan to the upper siderail on the side with the Raspberry Pi. The case has louvers on both sides and this location would allow the fan to blow air across the Raspberry Pi during operation and out the opposite louver. The buck converter was mounted to the rear panel with insulated foam mounting tape (be sure nothing on the bottom of the buck converter touches the metal back plate).
Step 3: Wiring It Up
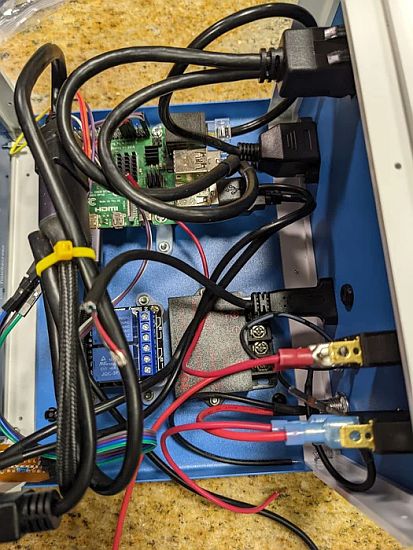
For me, this was one of the more difficult parts, because there are a lot of cables and wires to install. Start with all the power connections. See the attached wiring diagrams. Main power (12V) to the converter will be from a female coaxial barrel connector on the rear panel. The positive connection connects to the main power switch and from there to the converter. The 5V side of the converter connects to the Raspberry Pi (I used a salvaged USB power cable for this). It's important that you power the Raspberry Pi through the standard USB power connector on the Pi. Don't attempt to power the Pi through any of the GPIO pins – doing so will bypass the Pi's voltage regulator and could harm the Pi. Power for the relay board will also come from the converter 5V output – connect the positive side of this through the second switch on the back panel. This gives you a hard shutoff of the relays which is convenient when setting up or testing the monitor – you won't want it shutting down your modem and router if you accidently unplug the internet cable.
Next, run the power cables for the router power input and output. Also for the modem power input and output. For each, it is just the positive side of the cable that will connect through the relay. Be sure to use the Normally Closed (NC) connections on the relays – this way if you accidently remove power from the monitor, it won't remove the power from your modem or router.
Next, solder the 220 ohm resistors to the RGB LED. There are instructables on how to do this. I used tiny solder-seal heat-shrink connectors to solder the resistors to the LED leads and then to wires that I could then plug into the GPIO header on the RPi. If you look closely at the LED, you can tell which lead is the Cathode. Once you get that completed, install the RBG LED and connect it to the RPi. At this point, you'll have to drill a hole in the front panel in an area that won't be in the way of USB or HDMI cables. I've placed it at the very top or near the bottom. Either will work. Glue the LED to the panel and string the wires to the RPi. You'll later use a provided LED tester program to determine which lead is Red, Green, and Blue.
Finally, run the USB cables and HDMI between the Pi and the screen. Buy the shortest HDMI cable you can get – likely a foot or 10cm. In the photo, you can see that I had to coil mine up and tie it with a ziptie. The RPi requires a micro HDMI connector. You can either use an adapter or find a cable that has one on one of the two ends. For the USB cables, if you can't get right angle cable at the screen end, you may have to alter the strain-relief on the cable to make it bend. I've also bought solder-on micro USB male connectors and manually shortened the cables by soldering these on. Do that only if you're really good with the soldering iron – these are tiny solder joints.
Once it is all together, boot the RPi. It should automatically display to the screen. If it doesn't, check the USB connections or the HDMI. I've had problems with both – especially the power connector USB running from the RPi to the screen. The touch function should work as well. Test it out. I have had one screen that didn't work in one section. If that's the case, you might want to return it and get another.
Step 4: Software
The software for The Internet Monitor is written in Python 3. Software and other required files are stored on github in the following library: https://github.com/bartstar/Internet-Monitor.git
If you are new to the Raspberry Pi, configure your Pi according to instructions on the Raspberry Pi home website. I found it easier to SSH (using PuTTY) into the Pi from my laptop to access the files and enter commands. Be sure to turn off WiFi in the configuration menu. Data rates through WiFi will be significantly reduced from your true download speeds. The Internet Monitor should be directly connected to your router with an internet cable.
Once you have Pi up and running, set the screen resolution to 1280 x 764 in the configuration menu. Download the files in the github library and copy them to your Pi either using a USB thumb drive or other means. Store the files in the home directory /Home/Pi.
Before attempting to run the program, you'll need to load or be sure you have the following python libraries. It is best if you use administrator privilege to load these (sudo …..). If you haven't done this before, there are lots of tutorials on the web to show you how.
- tkinter
- time
- math
- numpy
- monotomic
- matplotlib
- ttkbootstrap
- speedtest
- ping
- datetime
You can now test the Internet Monitor by issuing the command:
sudo python3 internet_monitor_prod.py
The Internet Monitor must be run with administer privileges. Hence, sudo is required whenever executing the code. To install the Internet Monitor so that it runs automatically whenever the Pi reboots, follow the instructions in the header section of the code. It is also shown in the readme file on the github library.
Also follow the instructions to reboot your PI every day (I do mine at 7 minutes past midnight). This is needed to prevent the buildup of threads which can cause the program to fail after several days.
There are three additional programs in the github library. One is for testing the RBG LED. A second one is for testing the relays. And a third one is for testing Ubidots if you choose to use it.
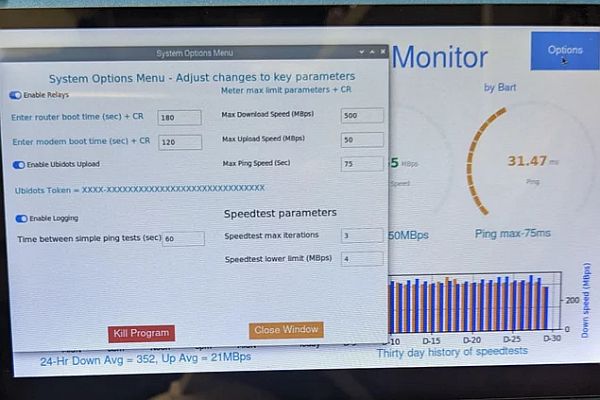
There are several configuration parameters that you will need to configure your monitor. Once you have it running, press or select the blue Options button at the top right of the screen. Once pressed, a menu window is opened with several options:
Switches:
- Enable Relays – this is a soft switch that turns on or off the power relays that are used to reset the modem and router. The default position (blue) is on. This switch setting is stored in the data file and will be remembered.
- Ubidots Enabled – this soft switch turns on or off the Ubidots upload option. This switch setting is stored int he data file and will be remembered.
- Enable Logging – this soft switch turns on or off logging. See the logging writeup in the entry section of the code or in the readme file. Creating of the logging file cannot be turned off, but by turning this switch off, you can temporarily halt logging entries. This setting is not stored in the data file and logging will be automatically restored at reboot time.
Numeric parameters:
- Router boot time and Modem boot time – this is the number (in seconds) which allows the router and modem to reboot after power is reset, before resuming speedtests.
- Max download speed – this is the max number shown on the download meter display. If your internet service maximum is 200MBps, you should probably set this to 250. I have a service ceiling of 400, but I sometimes record numbers as high as 450, so mine is set to 500.
- Max upload speed – this is the max number shown on the upload meter display. Set as you did for download speed
- Max ping speed – this is the max number shown on the ping meter display. This is the time between a speedtest request and a return acknowledgement of the request.
- Speedtest max iterations – if speedtest fails, it will retry for the number of times shown here. You can have more or less.
- Speedtest lower limit – this is set at default to 4MBps. A speedtest result lower than this is considered a failure and a retry will take place.
- Ubidots token – this is just shown if the Ubidots option is turned on. The actual token must be changed in the code.
Items in the code that you may want to change or configure:
- Ubidots token and Device Label for uploads – if you choose to upload your data to Ubidots, go to their website (ubidots.com) and sign up for a free account. You can list up to three devices within the free account option. This account allows you to automatically save data from your monitor for historical analysis.
- Number of attempts to upload Ubidots data – it will currently attempt 5 tries before failure. A note is displayed on the screen if it fails to upload.
- Logging level – currently logging data is set to ‘Warning' level log entries. Others that can be set are Info and Debug. The debug level will give you a lot of information in your log files. The warning level will only record significant failure events.
Operational notes:
- A log file is written to a file in /home/pi. The log file name is changed daily as “imon-ddmm.log” where dd is the day of the month and mm is the month of the year as a number (01-12). If the program is restarted more than once in a day, new log entries will be appended to the current log file. It is recommended that log files be deleted at least monthly using the “rm bw-ddmm.log” command at terminal to clear storage space. Logging can be turned completely off in the configuration menu. Logfile will always be created at startup, but logging can be turned off in the options menu.
- At startup, screen will remain blank until initial speedtest is completed
- Speedtest will usually be conducted every 30 minutes. The connection is an https: (secure) connection.
- If Speedtest encounters an HTTP 403 error (the speedtest server is refusing to answer) or a can't connect to the server error, the speedtest will be repeated every 60 seconds until successful or another error is encountered. If there are three general failures, the system will try a ping test to the Google DNS Server just to verify an internet outage. If the ping is successful, a zero response is recorded from the speedtest server and the program will continue normal operations.
- Ping tests with the Google DNS server will take place every 60 seconds between normal speedtests – three failuress in a row will trigger a speedtest
- LED will be illuminated BLUE during speedtests. LED will be illuminated RED if speedtest fails until program attempts retry
- Averages of download speeds and upload speeds exclude data entries that are zero – such as when server is undergoing maintenanct or other server issues
- Time to next speedtest is approximate (not exact)
- Ops Cycle shows the count of speedtests attempted
- Program will reboot at 00:07 (7 minutes after midnight to clear system memory, ops cycle will start over at 1 (reboot is setup in raspian, not in program)
- Booted will show time of last program start
- 24-Hr barchart (left side of screen) shows speedtests over the last 24 hours. Orange bar is the latest
- Month barchart (right side of screen) shows ping times (Orange) and download speeds (Blue). Most recent are left Orange and Blue bars
- Speedtest can be manually initiated by pressing blue button on left side of screen
- System Options Menu can be called by pressing blue button at top right of screen
- To kill the program, go into System Options Menu and select red “kill” button at bottom left of window. Optionally, do an ALT-TAB from keyboard attached to the Raspberry Pi, which will bring a command window to the screen. Click the “x” in the upper right corner to kill it.
- Fan speed is reduced or increased by adjusting the small potentiometer on the Buck Converter with a tiny screwdriver. Computer fan speed is determined by the voltage. Reducing the output of the Buck Converter will reduce the fan speed. Find a speed that is reasonably quiet but keeps the RPi cool (and be sure to place heat sinks on your RPi processor and other components)
Read more; The Internet Monitor