
Abstract
In recent decades, there has been a notable surge in the adoption of various personal computing devices, ranging from traditional desktop computers and laptops to tablets and smartphones. A more recent addition to this lineup is the Raspberry Pi, which has gained rapid popularity since its introduction in 2012, eventually becoming the best-selling British computer. Often hailed as a revolutionary computing device, the Raspberry Pi offers capabilities comparable to those of desktop computers. However, as with other computing devices, power consumption is a significant concern, particularly given the diverse functionalities they offer, such as communication and web browsing. This paper aims to examine how the power consumption of the Raspberry Pi is influenced by the key functionalities performed by users on the platform. Furthermore, this relationship is compared to that of other common personal computers, with the goal of recommending techniques and practices to mitigate the power consumption of this emerging computing device.
1. Introduction
As predicted by Weiser, technology has seamlessly integrated into the everyday lives of human beings through computers, smartphones, and tablets, among other devices [1, 2]. Recently, the number of mobile devices being used on Earth has surpassed the number of people inhabiting the planet [3]. Given this statistic, the ratio of all personal computers (e.g., desktop computers, smartphones, and tablets) to human beings is undoubtedly higher. The growing concern is that the number of computers is anticipated to increase further in the coming years [3]. Consequently, the power consumption of information and communication technologies (ICT) is expected to rise concurrently, as these devices are reliant on power [4]. Therefore, it becomes essential to investigate the power consumption of ICT devices, including personal computers, which encompass desktop computers, laptops, tablets, smartphones, and the recently developed Raspberry Pi (RPi).
As energy efficiency has become a critical design requirement for modern computing systems, various innovations in recent years have helped reduce power consumption of computers [5]. Different types of computers are known to consume varying amounts of power to operate; for example, a desktop computer consumes approximately 65 to 250 watts, while a laptop consumes around 15 to 60 watts [4, 6]. Reduced power consumption during the use of personal computers also translates to lower costs, extended battery life, and reduced adverse environmental impacts [5]. However, within modern computers, the diverse functionalities present, including communication (email, voice, etc.), web browsing, gaming, and video playback, among others, have been identified as important components that affect their power consumption [7]. In order to analyze the relationship between these diverse functionalities and power consumption in modern computers, various studies have been conducted.
A study aimed to analyze the power consumption of desktop computers by simulating 11 common usage scenarios [8]. The findings shed light on the power overheads associated with various scenarios and how usage patterns impact computer systems' power consumption. Similarly, profiling the power consumption of laptops' common usage scenarios and hardware revealed valuable insights into power-saving techniques [9, 10]. Likewise, analyzing the relationship between the diverse functionalities present in smartphones and power consumption helped develop an energy consumption model for the analyzed usage scenarios [7]. Furthermore, profiling the power consumption of different common functionalities within Android-based tablets uncovered the potential of CPU resource analysis tools for system-wide platform diagnosis [11].
Despite power consumption profiling being conducted for various features of different types of computers, including desktops, laptops, tablets, and smartphones, research on the emerging Raspberry Pi (RPi) is yet to be undertaken. This gap also hinders comparative power analysis of the RPi's functionalities against those of other types of computers. To address this gap, it is essential to address the following research questions:
– RQ1: What is the power consumption of the key functionalities performed by end-users on the RPi platform?
– RQ2: How does the data collected in RQ1 compare with the power consumption of other main types of personal computers, such as desktop computers, laptops, tablets, and smartphones?
– RQ3: How can the power consumption of the key functionalities of the RPi be reduced during the use of the key features identified in RQ1?
Understanding the power consumption of personal computers is crucial, as different devices rely on batteries, and optimizing power consumption can enhance battery life and contribute to sustainable computing [7]. This paper aims to address RQ1-RQ3 to provide insightful information on the power consumption of personal computers. RQ1 seeks to determine the power consumption when users perform various tasks on an RPi (e.g., web surfing, listening to music, etc.). RQ2 aims to compare the power consumption data collected in RQ1 with that of common types of personal computers. Finally, RQ3 explores strategies to save power when using the RPi to further reduce consumption during the investigated usage scenarios in RQ1. Before addressing the three research questions, background information on RPi and power consumption is provided.
2. Raspberry Pi and Power Consumption
The Raspberry Pi, introduced in 2012 by the Raspberry Pi Foundation in the UK, is a low-cost, credit card-sized single-board computer designed to promote the teaching of basic computer science in schools [12]. Since its inception, the Raspberry Pi (RPi) has rapidly become the fastest-selling British computer, with over 5 million devices sold in just three years [13]. It is available in two models, Model A and Model B, which vary in technical specifications such as RAM, USB ports, and network connectivity [14]. Often hailed as a revolutionary tool, the RPi is capable of performing a wide range of tasks typically associated with desktop computers, including web surfing, video streaming, word processing, programming, and gaming [15].
The RPi draws power from three different sources for its operation. Firstly, it can be powered using a 5V micro USB mains adapter with a 1200mA current. Alternatively, the RPi can be powered using a USB-based portable battery compatible with smartphones. Another option is the Mobile Pi Power (MoPi), a power regulator that accepts multiple inputs (such as solar cells, car power sockets, or standard batteries) and allows for seamless power supply swaps. Additionally, users have the option to power the RPi using a battery box that runs on six or more AA batteries.
Like other computer systems, the RPi consumes power during operation, including power required to operate hardware components and perform tasks or run software. Recently, a power consumption model for the Raspberry Pi, called PowerPi, was proposed based on measurements of different power states of the platform [16]. However, while PowerPi models and measures the power consumption of various components such as the CPU, Ethernet, and USB Wi-Fi dongle, it does not thoroughly investigate the power consumption of the diverse functionalities present within the platform. Therefore, there is a need to address RQ1-RQ3.
3. Methodology
RQ1 and RQ2 explore the power usage of various types of personal computers, including the Raspberry Pi, desktop computers, laptops, tablets, and smartphones. Therefore, different devices are examined as part of this investigation. Addressing RQ1 and RQ2 also requires identifying and listing the primary functionalities typically executed by end-users on these devices. This section outlines the methodology employed to address the research questions and provides a comprehensive overview of the experimental setup and procedures.
A. Devices under Test
This study included the participation of five distinct types of personal computers, with a random device selected for each category. The chosen devices for testing were:
1.Raspberry Pi
A Raspberry Pi 2 Model B, operating with a software image of Raspbian Wheezy, was employed, with specifications outlined in Table I.
| Component | Specifications |
| CPU | 900MHzquad-coreARMCortex-A7 |
| RAM | 1GB |
| Wi-Fi | via Wi-Fi dongle |
| 3D Graphics | VideoCoreIV3Dgraphicscore |
| Other Interfaces | Camera interface (CSI), Display
interface(DSI) |
2. Laptop
A 64-bit Windows 7 (Service Pack 1) operating system was installed on an HP ProBook 4530s laptop. The device's specifications are detailed in Table II.
| Component | Specifications |
| CPU | 2.30GHz Intel(R) Core(TM) i5-
2410MCPU |
| RAM | 8GB |
| Webcam | Integrated |
| Network Adapter | QualcommAtherosAR9285 |
| 3D Graphics | Mobile Intel(R)HD Graphics and
RadeonHD6490M |
3. Desktop Computer
A desktop computer equipped with 64-bit Windows 7 (Service Pack 1) and the specifications outlined in Table III was employed.
| Component | Specifications |
| CPU | 3.30GHzIntel(R)Core(TM)i3-2120
CPU |
| RAM | 4GB |
| Network Adapter | Realtek PCIe RTL8111F – 10/100/1000 Controller |
| 3D Graphics | Intel(R)HDGraphics2000 |
4. Smartphone
| Component | Specifications |
| CPU | Quad-core1.5GHzCortex-A53 |
| RAM | 3GBRAM |
| Display | Super AMO LED capacitive touchscreen |
| Component | Specifications |
| CPU | Exynos®5Octa(1.9GHzQuadcore+1.3
GHz Quadcore) |
| RAM | 3GB |
| Display | Super clear LCD capacitive touchscreen |
B. Features under Investigation
As RQ1 and RQ2 delve into examining the power usage of key functionalities across different platforms, it was necessary to create a comprehensive list of such common operations. To achieve this, the common usage scenarios identified in previous research [8, 10] were collected and expanded upon to encompass a broader range of tasks. During this compilation phase, only tasks that could be universally performed across all platforms were included. Consequently, tasks like sending an SMS or making phone calls, which are specific to smartphones, were excluded. The compiled features being investigated are detailed in Table VI.
| No. | Operation | Description |
| O1. | Device Start-up | Switching on the device under test until the welcome screen is shown. |
| O2. | Idle Mode | During idle mode of the device under test. |
| O3. | File-
Management Operation I |
Involvedcopyingafileofapprox.2GBfrom
one location to another on the same disk used by the device under test. |
| O4. | File-
Management Operation II |
InvolvedcopyingthesamelargefileinO3
from the device under test to an external source via USB. |
| O5. | Surfing the web | Involved actively surfing the IEEE Xplore
website to browse research papers using the default browser in device under test. |
| O6. | Playing a browser game | Involved playing the online Cut the Rope[18]game using the default browser in the device
undertest. |
| O7. | Downloading a file | Involved downloading a file of approximately1GBusingthedefaultbrowserinthedevice
undertest. |
| O8. | Playing an installed game | Involved playing an installed computer game. For this, the classic Pacman was chosen due to its availability on all platforms. |
| O9. | Listening to Music | Involved listening to music (an MP3 file) by using the default music player in the device
undertestwhilevolumesetas50%. |
| O10. | Watching a
video |
Involved watching a movie using the default
movie player in the device under test. |
| O11. | Watching a
video online |
Involved watching a video on YouTube using
the default browser in the device under test. |
| O12. | Using Image
Gallery |
Involved going through a set of images within
the device under test under full-screen mode. |
| O13. | Word-
processing |
Involved using the Word package to actively
write a document in the device under test. |
| O14. | PowerPoint
Presentation |
Viewing a Power Point presentation in the
device under test. |
| O15. | Calling using a Messenger | Involved talking(with video disabled)with another contact using Skype installed in the device under test. |
| O16. | Calling using a Messenger II | Involved talking(with video enabled)with another contact using Skype installed in the
device under test. |
| O17. | Reading a PDF | Involved reading a PDF manual using the
default pdf reader in the device under test. |
| O18. | Installing an
Application |
Involved installing a new application on the
device under test. |
| O19. | Sleep Mode | Switching the device under test to sleep mode. |
| O20. | System shut
down |
Involved switching off the device under test
from the idle state. |
Various operations outlined in Table VI required the utilization of specific software. To accomplish this, the version compatible with the device being tested and its operating system was employed. Additionally, certain operations necessitated the utilization of specific files (such as .mp3 files for O9, movies for O10, and images for O12, among others), and in such cases, identical files were utilized across all platforms whenever feasible.
C. Measurement Methodology
Due to the absence of a standardized power measurement tool compatible with all platforms under examination, different hardware and software were employed to measure the power consumption of operations outlined in Table VI. When devices could be powered directly from the outlet using electric current, the Eco-Worthy electronic wattmeter was employed. Hardware-based measurement was favored over software due to its superior accuracy [10]. To use the power meter, the device was plugged into the power socket, and then the device under test was connected to the power meter. It's worth noting that while the meter itself requires electricity to operate, it registers 0.0W when no device is connected to it.
Additionally, only CPU power was taken into account during the experiment to ensure more accurate comparative values for RQ2. For the RPi and desktop computer, CPU power could be directly measured using the power meter. However, for the laptop, the power consumed by the screen component had to be deducted from the power meter readings. To measure screen power consumption, Microsoft Joulemeter was calibrated and employed. Furthermore, the laptop's battery was removed to ensure that the device under test was powered directly from the socket connected to the power meter.
For smartphones and tablets, the power meter could not be utilized as these devices do not function without a battery when plugged directly into the power outlet. Instead, PowerTutor was used to measure the power consumption of both devices. This tool has been utilized in various studies related to power measurement of components within Android-based devices [17, 18].
D. Experimention Procedures
To commence the experiment, the research team activated the power measurement tool for the designated device under examination. For the Raspberry Pi, desktop computer, and laptop, the device was initially turned off and then connected to the power meter, ensuring that the meter displayed a reading of 0.0W. In the case of the smartphone and tablet, PowerTutor was launched, and profiling commenced within the application. Once the power measurement mechanism was initiated, the first operation listed in Table VI was executed.
If the operation required internet connectivity, network access was enabled. Otherwise, Wi-Fi connectivity was disabled to prevent background processes from utilizing the network, thereby potentially increasing the device's power consumption. Throughout the operation, readings from the power measurement tool were recorded at 2-second intervals for up to 2 minutes, ensuring an adequate number of values for reliability.
For instance, to measure the power consumption of O1, once the power button of the device under test was pressed, readings from the power meter were captured every 2 seconds until the welcome screen appeared. These recorded values were then averaged. This process was repeated three times to ensure result reliability, and the overall average for the three instances was calculated. The same procedure was replicated for all operations listed in Table VI and across the various devices under examination.
Upon conclusion of the experiment, the collected data were subjected to analysis using a statistical package, specifically SPSS.
4. Results and Discussions
The mean power readings obtained from the three iterations of the experiment with each device under evaluation are presented in Table VII.
|
No. |
AveragePowerConsumption(W) | ||||
| Desktop | Laptop | Smartph
one |
Tablet | RPi | |
| O1. | 47.50 | 31.40 | 2.80 | ||
| O2. | 33.80 | 10.20 | 0.12 | 0.16 | 2.20 |
| O3. | 37.10 | 13.10 | 0.14 | 0.21 | 2.60 |
| O4. | 37.80 | 14.20 | 0.14 | 0.25 | 3.20 |
| O5. | 42.30 | 20.70 | 0.60 | 0.36 | 3.40 |
| O6. | 49.30 | 29.00 | 0.67 | 0.66 | 3.80 |
| O7. | 39.70 | 14.40 | 0.81 | 0.42 | 3.50 |
| O8. | 44.60 | 26.30 | 0.52 | 0.49 | 2.30 |
| O9. | 36.50 | 12.30 | 0.48 | 0.40 | 2.40 |
| O10. | 38.80 | 14.40 | 0.51 | 0.42 | 2.80 |
| O11. | 46.50 | 22.90 | 0.80 | 0.54 | 4.00 |
| O12. | 36.50 | 15.70 | 0.15 | 0.22 | 2.60 |
| O13. | 34.20 | 11.90 | 0.14 | 0.19 | 2.40 |
| O14. | 35.60 | 12.40 | 0.15 | 0.19 | 2.50 |
| O15. | 40.40 | 17.80 | 0.86 | 0.28 | |
| O16. | 46.80 | 22.70 | 0.91 | 0.37 | |
| O17. | 38.10 | 15.80 | 0.17 | 0.23 | 2.60 |
| O18. | 44.20 | 19.90 | 0.29 | 0.19 | 2.90 |
| O19. | 29.20 | 1.20 | |||
| O20. | 40.20 | 27.20 | 2.30 | ||
Throughout the experiment, it was noted that both the electronic wattmeter and PowerTutor recorded power consumption at regular one-second intervals. Furthermore, according to Table VII, certain operations could not be finalized due to constraints elaborated in subsequent sections, as efforts were made to address RQ1 and RQ2.
A. R Pi Power Consumption Analysis(RQ1)
During the RPi experiment, three operations—O15 and O16—could not be conducted because no compatible version of Skype was available for installation on the RPi at the time of the experiment. Although Skype could potentially be installed through a virtual machine like ExaGear Desktop, doing so would introduce inconsistencies in the experimental setup and additional parameters to measure, such as the power consumption of the virtual machine. Additionally, O19 could not be measured as the RPi Model B does not have a sleep mode feature.
The results presented in Table VII indicate that each usage scenario consumes more power than when the device is in idle mode (O2). This suggests that both software usage and connected hardware have an impact on the overall power consumption of the Raspberry Pi. Furthermore, the power consumed by the RPi increased with the addition of more connected devices. For example, without any attached external hardware, the RPi's power consumption was 2.10W, which increased to 2.20W when a mouse and keyboard were connected.
Additionally, the power consumption of each operation varied, with no two operations showing the same average power consumption. This variability can be attributed to various factors affecting the CPU's power consumption during operations, including workload and processing speed. Overall, the average power consumption across the investigated operations was 2.84W, only 0.60W higher than idle mode power consumption. This relatively small difference highlights the RPi's reasonably low overall power consumption during common operations. Among the operations investigated, watching an online video and playing an online game consumed the most power.
From the collected results, it was observed that operations requiring internet connectivity consumed relatively more power than those performed offline. For example, watching an online video consumed 4.00W compared to 2.80W for watching the same video via the default video player on the device under test. This disparity is due to the significant energy cost associated with wireless communication on computational devices. Overall, operations requiring internet connectivity averaged 3.68W compared to 2.58W for those not requiring internet connectivity. These trends are visually depicted in the boxplot shown in Fig. I.
B. Comparison of R Pi Power against Other Platforms(RQ2)
In comparison to laptops and desktop computers, several operations on smartphones and tablets could not be measured, specifically O1 (device start-up), O19 (sleep mode), and O20 (system shutdown). This limitation arose because PowerTutor was unable to operate during these modes, namely during device startup, shutdown, and while in sleep mode. Similar to the RPi, all other platforms tested exhibited minimal power consumption when the devices were in idle mode (O2). Additionally, operations requiring internet connectivity consumed more power than those performed offline. A line graph illustrating the power consumption comparisons among the various devices under test is provided in Fig II.
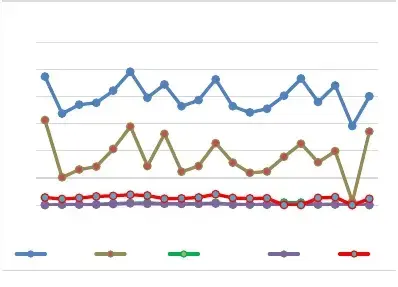
As illustrated in Fig. II, the various platforms under examination exhibited a similar power consumption trend for most operations investigated. However, a significant deviation was noted for O8—playing an installed game—where the laptop demonstrated a 157% increase in average power consumption compared to a 32% rise for the desktop computer and a 5% increase for the RPi, relative to idle power. Despite using the same game for both the laptop and desktop computer, the variance could be attributed to the differing specifications of the computers under test.
Overall, the results indicated that the desktop computer was the highest power consumer, averaging 39.96W, which is more than 10 times higher than the average power consumption of the RPi for the same set of operations. Notably, under sleep mode, the desktop computer continued to consume 29.20W, compared to only 1.20W for the laptop. While the laptop consumed less average power than the desktop computer at 17.68W, it still consumed over four times more power than the RPi. The smartphone and tablet emerged as the least power consumers of the experiment, averaging 0.44W and 0.33W, respectively, underscoring significant optimization efforts to reduce power consumption in battery-operated devices.
The study also encountered several challenges. Chief among them was the fluctuating values in power measurements for various operations, attributed to the software and hardware components within the devices under test. Operations requiring internet connectivity, such as web surfing (O5), playing a browser game (O6), and using messenger apps for calls (O15 and O16), exhibited the highest fluctuations, likely due to user-triggered events like voice and video inputs, mouse clicks, etc. To ensure reliability, power measurements were periodically recorded, and experiments were repeated multiple times. Standardizing operation procedures, such as consistent typing behavior for O13 and slide change intervals for O14, also helped ensure reliable power readings.
In terms of limitations, the inability to use a standardized power measurement mechanism for all devices was a major constraint. The experiment employed three different mechanisms—electronic wattmeter, PowerTutor, and Microsoft Joulemeter—and the inaccuracies of the software approach to measure power could affect recorded measurements. Additionally, the use of different tools resulted in varying precisions, with PowerTutor measuring in mW and the electronic wattmeter providing measurements in W (with one decimal place).
In conclusion, the experiment demonstrated that the RPi can be considered a low-power device compared to desktop computers and laptops. As a low-cost and low-power device, the RPi has the potential to save both money and energy if effectively integrated into households. However, adopting best practices can further reduce costs when using the RPi.
5. Further Reducing R Pi Power Consumption
To further diminish the power usage of the RPi and address RQ3, several methods and optimal strategies can be implemented during its functioning. These include:
- Disconnect Peripherals that are not in use
Throughout the experiment, it became evident that adding additional peripherals to the RPi had an impact on its power consumption. One simple method to conserve power with the RPi is by deactivating or unplugging peripherals that are not actively being utilized. For example, if a connected printer or webcam is not currently in use with the RPi, it can be disconnected.
2.Work offline when ever possible
Findings indicated that activities requiring network connectivity exhibited higher power consumption compared to offline tasks. By disconnecting from the network whenever feasible, power consumption could potentially decrease by around 30%, based on calculations.
3. Switch-off device when not in use
When sleep mode is unavailable on the RPi, one strategy to conserve power is to completely power off the device when it is not in use.
4. Using the RPi in headless mode
Turning off the HDMI when operating the RPi in headless mode could result in reduced power consumption.
5. Using daemons wisely
Research findings indicate that running multiple daemons concurrently on the RPi leads to increased energy consumption by the processor. Therefore, it is recommended to utilize power-efficient applications that do not necessitate extensive software stacks. While there are additional power-saving techniques beyond those outlined previously, further evaluation is necessary to determine their efficacy.