Introduction
Ensuring good health is always a top priority. However, modern lifestyles often expose individuals to various potentially harmful factors, such as high blood pressure and irregular heart rate. High blood pressure, or hypertension, places added strain on the heart as it pumps blood through the arteries. This condition is a significant risk factor for stroke, heart attacks (myocardial infarction), heart failure, aneurysms (including aortic aneurysms), peripheral arterial disease, and chronic kidney disease. Meanwhile, a normal resting heart rate for adults typically falls within the range of 60 to 100 beats per minute. Although variations within this range are considered normal, an abnormally high or low heart rate may signal an underlying health issue.
To enable individuals to monitor these crucial health indicators regularly from the comfort of their homes, we have developed a cost-effective health monitoring system. This system is designed to measure blood pressure, heart rate, and body temperature accurately and affordably.
Objective
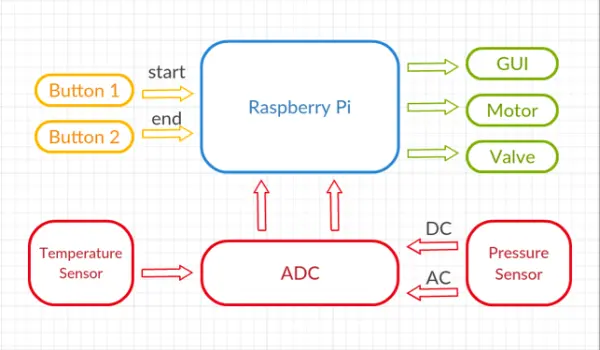
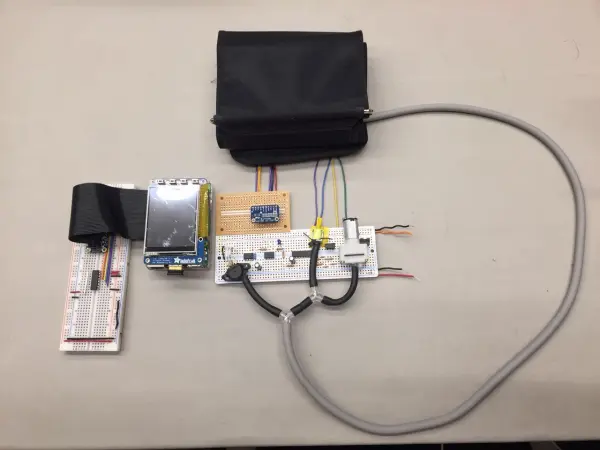
Our ultimate project objective is to develop and construct a health monitoring system capable of assessing blood pressure, heart rate, and body temperature using an inflatable cuff, with subsequent display of test results on a computer screen. The device comprises four primary components: hardware components including a computer monitor, inflatable cuff, Tygon tubing, and 3-way splitter; an analog circuit; a motor and valve control circuit; and a Raspberry Pi 3. The aim is to seamlessly integrate all circuitry components to enable comprehensive health parameter measurement via the inflatable cuff.
High-Level Design
High-Level Block Diagram
Body Temperature Measurement Mechanism
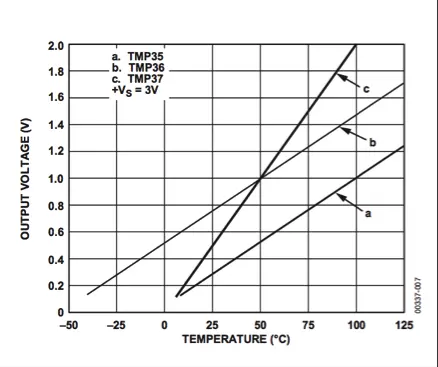
For our design, we opted to employ the TMP36 as the body temperature sensor. The TMP36 is renowned for its low voltage and precision centigrade temperature sensing capabilities. It operates by providing a voltage output that exhibits a linear correlation with the Celsius temperature, with a scale of 10 mV/°C. An inherent advantage of this sensor is its ability to deliver typical accuracies without necessitating external calibration. To extract temperature data, we utilize an ADC to measure the voltage output from the Vout pin, facilitating straightforward conversion to temperature values.
Blood Pressure Measurement Mechanism
In everyday healthcare practice, the sphygmomanometer stands as the quintessential device for measuring blood pressure. Comprising a cuff, which can be inflated using a manually operated bulb and deflated via a valve, alongside a mercury manometer for pressure measurement, the sphygmomanometer offers a fundamental tool in medical assessment. During the measurement process, the cuff undergoes rapid inflation to approximately 180 mmHg, exceeding the systolic pressure. Subsequently, controlled release of air through the valve ensues, while the physician simultaneously listens with a stethoscope and monitors the sphygmomanometer. The appearance of a knocking sound at the patient's systolic pressure marks a significant point in the process. As the knocking sound dissipates, the corresponding pressure indicates the patient's diastolic pressure [1].
In our design, we emulate this blood pressure measurement procedure. Upon program initiation, a motor initiates air pumping into the cuff until the pressure reaches around 180 mmHg, ensuring it surpasses the average systolic pressure. Subsequently, controlled release of air from the cuff occurs through brief valve openings, lasting 0.05 seconds every 4 seconds. Concurrently, as the cuff undergoes controlled deflation, we observe minute oscillations in air pressure within the cuff, attributable to heartbeats. The onset of discernible oscillations indicates the systolic pressure, while their cessation signifies the diastolic pressure. Throughout these processes, an analog-to-digital converter (ADC) converts all signal readings from the pressure sensor, transmitting them to a Raspberry Pi for subsequent calculations.
Heart Rate Measurement Mechanism
In our design, heart rate measurement coincides with blood pressure measurement. Upon observation, we note that following the appearance of systolic pressure for a few seconds, the heart pulse reaches its peak strength and stability. During this stable period, we record both the heartbeat count and duration time. Once all measurements are completed, heart rate can be easily calculated by dividing the heartbeat count by the duration time, expressed in minutes.
Hardware and Software Tradeoffs
Numerous compromises were made regarding both the hardware and software aspects of this project.
In terms of hardware, our initial choice for the Analog-to-Digital Converter (ADC) was the MCP3008, offering 10-bit resolution and utilizing the SPI serial interface throughout the project. However, during the testing phase with the pressure sensor, we discovered significant inaccuracies in the ADC readings, deviating from our expectations. Consequently, we opted to discontinue the use of the MCP3008 and switched to the ADS1115, which provides a higher accuracy with its 16-bit resolution.
Another hardware tradeoff arose in the method of heart rate measurement. Initially, we endeavored to construct an infrared heart pulse sensor utilizing an infrared emitter and detector. Unfortunately, the reflected signal from the fingertip proved to be insufficient, significantly impacting measurement accuracy. Furthermore, the design necessitated strict coverage of both the emitter and detector by the user. Any gaps in coverage substantially reduced measurement accuracy. As a result, we abandoned this approach and pursued an alternative solution, as described in the heart rate measurement mechanism section above.
On the software front, our initial intention was to plot the electrocardiogram simultaneously while acquiring data from the pressure sensor. However, real-time plotting of the electrocardiogram proved to be slow, leading to a notable reduction in the data-sampling rate. The sampling rate plummeted from 0.05s per sample to nearly 0.8s per sample. With such a diminished sampling rate, pulse detection became markedly inaccurate, significantly impacting the quality of results. Consequently, we opted to prioritize data acquisition first, storing all acquired data in a text file. Subsequently, post-measurement, we read the data from the text file and plotted the electrocardiogram accordingly.
Hardware Design
Temperature Sensor
The TMP36 is a precision centigrade temperature sensor designed for low voltage applications. It delivers a voltage output directly correlated with Celsius temperature in a linear manner, with a scale of 10 mV/°C as depicted in Figure 2. One notable advantage of this temperature sensor is its inherent accuracy, eliminating the need for external calibration to achieve typical accuracies.
Pressure Sensor
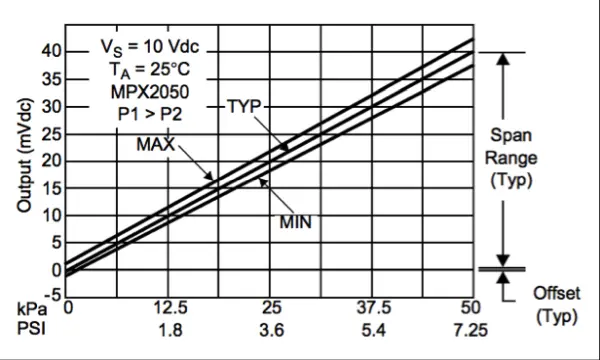
We utilize the MPX2050GP pressure sensor to gauge the air pressure within the handcuff. The MPX2050GP offers a voltage output that is notably precise and linear. This output voltage exhibits direct proportionality to the pressure applied, as depicted in Figure 3.
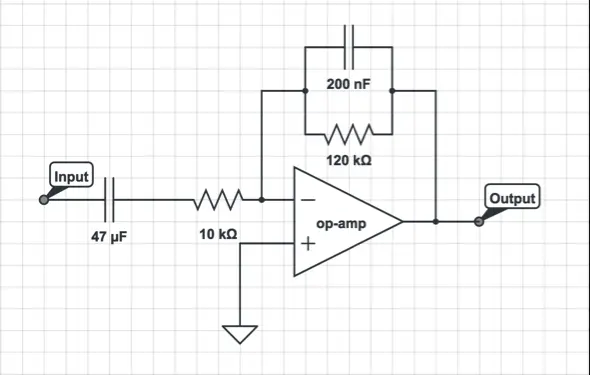
Filters
The filter utilized is an active band-pass filter designed to amplify signals significantly while effectively eliminating noise, thereby enhancing the output's signal-to-noise ratio. The schematic of the band-pass filter circuit is depicted in Figure 4.
Amplifier
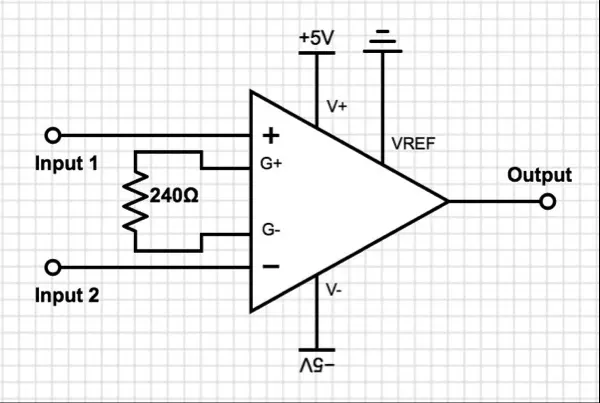
Due to the minimal magnitude of the output signal from the pressure sensor, amplification is necessary for subsequent processing. We've opted for the AD620, an economical, energy-efficient, and precise instrumentation amplifier. Its configuration requires just one external resistor to establish the desired gain. As per the specifications of the AD620, adjusting the gain is achievable by incorporating resistors between Pins 1 and 8.

To increase the pressure sensor signal by approximately 200 times, we have selected a 240-ohm resistor (RG) based on the provided equation. The calculated gain from this equation is 206.8333. The amplifier circuit can be observed in Figure 5.
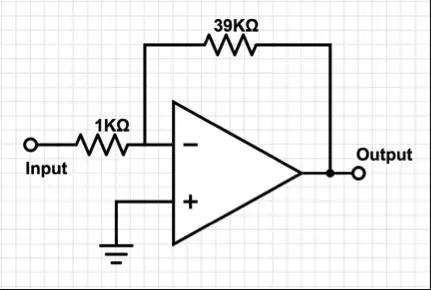
Following the band-pass filter stage, we employ an additional amplifier to further amplify the AC output. The schematic of this amplifier is depicted in Figure 6.
Motor Cntrol
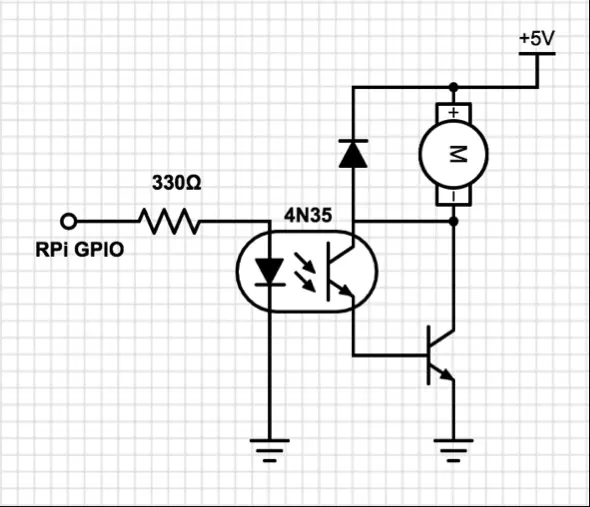
The Raspberry Pi GPIO pin manages motor control. Motors, known for their noise and high current consumption, can generate inductive spikes that pose a risk to the transistors in the Raspberry Pi. To mitigate this risk, we employ an optoisolator (4N35) to fully isolate the Raspberry Pi from the motor. This optoisolator safeguards the remaining circuitry from any unintended consequences of motor operation. Additionally, a diode is strategically placed across the motor to suppress spikes that occur when the motor is deactivated. Refer to Figure 6 for the motor control circuit diagram.
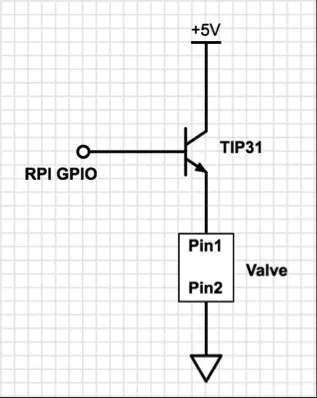
Valve Cntrol
The valve is operated by employing an NPN transistor as a switch. The base of the transistor is linked to a Raspberry Pi GPIO pin. In this configuration, activating the valve involves setting the GPIO pin to a high state, while deactivating it entails setting the GPIO pin to a low state. The schematic illustrating the control of the valve is depicted in Figure 7.
Hardware Integration
Software Design
State Diagram
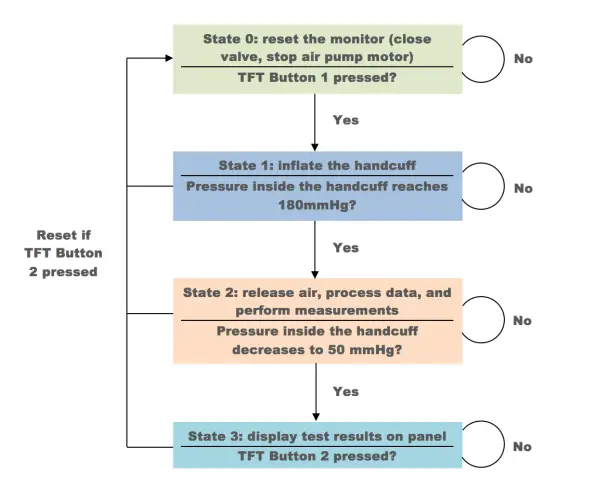
The health monitor control system comprises four distinct states:
1) State 0: This serves as the reset state, ensuring the health monitor remains in sleep mode before commencing measurements. The air pump motor remains inactive, and the air valve remains open, preventing any air from being pumped into the handcuff. Upon pressing the first button on the TFT, the system transitions to state 1; otherwise, it remains in state 0.
2) State 1: In this state, the system initiates the inflation of the handcuff until the pressure inside reaches 180mmHg. Once this pressure threshold is achieved, the system proceeds to state 2. However, in case of an emergency, pressing the second button on the TFT at any time will trigger an immediate release of air, resetting the system to state 0.
3) State 2: This represents the core state of the health monitor and entails a relatively heavier workload compared to other states. Here, the handcuff gradually releases air through the voltage-controlled air valve. Concurrently, the program reads signals from the ADC, processes the data, computes heart rate and blood pressure, and saves the raw data to an output file for future visualization of heart pulse. When the cuff pressure drops to 50mmHg, typically indicating completion of most measurements for individuals, the system loops back to state 2.
4) State 3: In this state, the system measures body temperature, displays test results on the panel, and visualizes heart pulse. Most measurements are concluded in state 2, except for body temperature. Once body temperature data is acquired, all test results are showcased on the panel. Additionally, heart pulse visualization is conducted in this state, which is a time-consuming process as the Raspberry Pi animates heart pulses and draws them on a single plot. Upon completion of the cardiogram, the system remains in state 3 until either the reset button or quit button is pressed.
Analog-to-Digital Converter
MCP3008
The MCP3008 serves as an 8-channel 10-bit analog-to-digital converter primarily designed for reading straightforward analog signals, such as those generated by a temperature sensor. Initially, we attempted to utilize the MCP3008 for both temperature and pressure sensing applications. However, subsequent experimentation revealed that while the MCP3008 accurately detected signals from the temperature sensor, it proved unsuitable for detecting heart pulses through the pressure transducer. The latter application demanded greater sensitivity and a higher bit resolution to obtain precise data. Consequently, we opted to retain the MCP3008 for temperature measurements and transitioned to the ADS1115 for blood pressure monitoring, anticipating superior results.
To facilitate data acquisition from the MCP3008, we developed a Python script consisting of 100 lines, as outlined in the Code Section below. The script employs SPI communication to retrieve data from the MCP3008, utilizing four GPIO pins: SPIMOSI, SPIMISO, SPICLK, and SPICS.
ADS1115
The ADS1115 is a highly regarded analog-to-digital converter (ADC) renowned for its compatibility with the Raspberry Pi via the I2C communication bus. It boasts a 16-bit precision and offers four channels for enhanced versatility. The resulting 16-bit signed integer values can accurately represent decimal numbers ranging from 0 to 32767. Notably, with the ADS1115 powered by the Raspberry Pi's 3.3V supply, the voltage range corresponds directly to the integer range, with 0 representing 0V and 32767 representing 3.3V.
sudo apt-get update
sudo apt-get install build-essential python-dev python-smbus git
cd ~
git clone https://github.com/adafruit/Adafruit_Python_ADS1x15.git
cd Adafruit_Python_ADS1x15
sudo python setup.py install
To use the ADS1115 in our Python program, we import the Adafruit_ADS1x15 and create an ADS1115 instance, adc = Adafruit_ADS1x15.ADS1115(). Then data can be read from the selected channel x, data = adc.read_adc(x, gain=GAIN), where x is a integer from 0 to 3.
To utilize the ADS1115 with the Raspberry Pi, the Adafruit ADS1x15 Python library needs to be installed from the source on GitHub. This can be achieved by executing specific commands within the terminal environment.
Motor and Valve Control
The Raspberry Pi controls both the motor and valve, with each connected to separate NPN transistors. The base pins of these transistors are linked to GPIO 21 and 16. When the GPIO is set to a high state, the motor activates and the valve opens.
However, a limitation of our air valve is its binary nature, capable only of being fully open or fully closed, thus lacking the ability to regulate airflow. When the valve is fully opened during state 2, the rapid release of air from the handcuff occurs within a second, too swift for the pressure sensor or Raspberry Pi to capture the heart pulse signal accurately. To address this issue, we modify our program to control the valve in intervals, releasing air every 4 seconds for a duration of 0.05 seconds each time, allowing for gradual deflation of the handcuff.
Another issue arises from the rapid deflation of the handcuff, causing fluctuations in the internal pressure that generate noisy data, obstructing the detection of the true heart pulse signal. To mitigate this, we introduce a delay of 1 second in the program after the valve ceases releasing air, allowing the pressure inside the cuff to stabilize before reading data from the ADC. Below is the pseudo code outlining the valve control mechanism.

Body temperature measurement
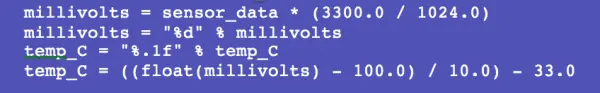
The TMP36 serves as the temperature sensor within the monitoring system. It produces an analog signal that varies linearly with temperature. Operating within a temperature range spanning from -40 degrees Celsius to 150 degrees Celsius, the TMP36 outputs a voltage ranging from 0.1V at -40 degrees Celsius to 2.0V at 150 degrees Celsius. To digitize the analog signal from the TMP36 for the Raspberry Pi, we utilize the MCP3008 analog-to-digital converter. Powered by the Raspberry Pi at 3.3V, the MCP3008 features a resolution of 10 bits, equivalent to 1024 in decimal. Therefore, each bit represents 3300.0/1024.0 mV. Subsequently, we employ a conversion equation to translate the digital signal into temperature in Celsius.
The temperature reading obtained from TMP36 typically stabilizes within approximately 10 seconds. Therefore, we integrate the sensor measurement process into the main while loop. This allows us to simultaneously display the final temperature, along with heart rate and blood pressure readings, on the panel.
Heart rate measurement
Throughout the measurement process, the heart pulse manifests shortly after systolic pressure and ceases before diastolic pressure. As the heart pulse drives fluctuations in the pressure within the cuff, the data retrieved from the ADC also experiences oscillations. The accompanying figure illustrates the processed AC output signal, denoting the detection of heart pulses by the pressure sensor.
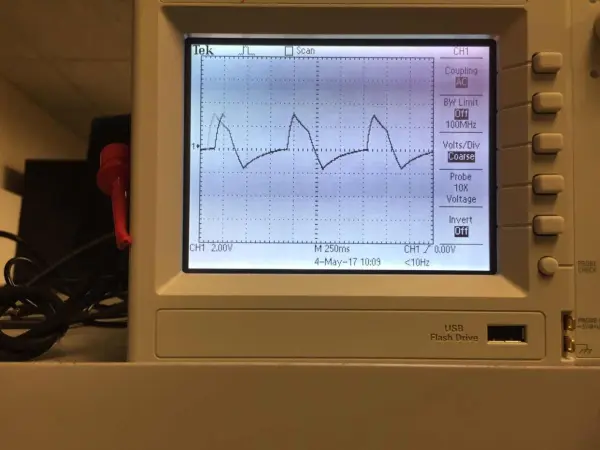
As depicted in the illustration, the waveform exhibits a distinct sharpness, providing a clear representation of the heart pulse. This snapshot is captured during a period of steady and relatively robust heart activity. However, it's essential to recognize that the intensity of the heart pulse varies across different time intervals. Initially, when the heart pulse emerges, fluctuations in the signal may occur due to the continued pressure from the handcuff, which can impede blood flow. Consequently, some weaker heartbeats may go undetected. As the pressure inside the cuff decreases to a certain level, most heartbeats become sufficiently strong to register, and their digital signals reach a threshold exceeding 25000 on the ADC. The steady state typically commences approximately 15 seconds after the onset of measurements.
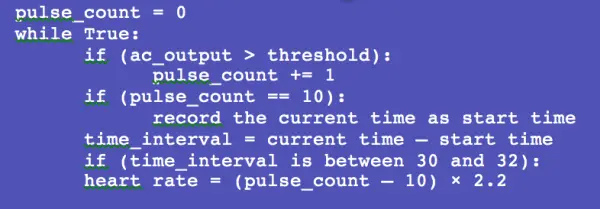
Within the code, we select the time interval characterized by the strongest oscillations in the waveform. We define this interval to commence after the detection of 10 heartbeats. Subsequently, we count the number of heartbeats over a span of 30 seconds, enabling us to calculate the heart rate by multiplying the count of detected heartbeats by 2. However, due to the inherent limitations in detecting all heartbeats, calibration has revealed that multiplying by 2.2 yields a more accurate estimation of the heart rate. The following pseudo code outlines the fundamental logic behind heart rate measurement.
Blood pressure measurement
As discussed in the preceding section, systolic pressure is measured upon the detection of the first heartbeat, while diastolic pressure is recorded when the heartbeat cannot be detected entirely. Although the underlying logic is straightforward, the presence of noisy data necessitates careful consideration. Due to the high sensitivity of the pressure sensor, even minor user movements can generate significant noise patterns that mimic heartbeat signals, thus compromising the accuracy of the test results considerably. To mitigate the impact of noisy data, our program employs a strategy whereby systolic pressure is outputted after counting three heartbeats, while diastolic pressure is determined when the number of non-pulse data exceeds 40 instances, equivalent to a duration of 2 seconds (40×0.05 seconds). The pseudo code for this approach is provided below.

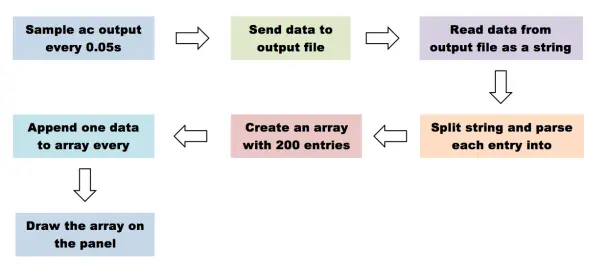
Heart Pulse Visualization and User Interface
Initially, our endeavor was to visualize heart pulse in real-time. However, we encountered challenges in finding a suitable Python library that fully supported this functionality. We experimented with Plotly, a paid visualization tool renowned for creating charts and scientific graphs. While Plotly allowed for real-time data sensing, its limitation was that it operated exclusively as an online tool, thereby restricting graph display to web browsers.
Subsequently, we turned to matplotlib, a Python plotting library, along with its numerical mathematical extension Numpy. Although the animation of heart pulse was achievable using matplotlib's animation function, it posed a hindrance by blocking program execution. Despite our efforts to explore various approaches, we were unable to resolve this issue.
Furthermore, we observed that drawing data on the panel using matplotlib imposed significant computational burden. Despite our attempts to optimize execution speed, the drawing process remained sluggish and interfered with data reading from the ADC. To ensure smooth data acquisition, we made the decision to read and process data exclusively in state 2, reserving state 3 for heart pulse visualization.
In state 2, data is transmitted to an output file, which is subsequently accessed in state 3 for visualization purposes. The state diagram below illustrates our approach to animating the heart pulse signal.