
Testing out Raspberry Pi 4's temperature profile with and without fan(s) using ProtoStax for Raspberry Pi B+/Model 4B enclosure/case.
With my hands on my newly acquired Raspberry Pi 4, the first thing on my agenda was to make the necessary modifications to the ProtoStax for Raspberry Pi B+ case/enclosure to be able to accommodate the different port locations of the new Pi 4. Modularity is the key strength of ProtoStax, and I was able to accommodate the new Pi 4 by making a new side wall to fit the new USB/Ethernet port locations (this additional side wall is included with the aptly renamed ProtoStax for Raspberry Pi B+/Model 4B enclosure, so it can support older versions as well the new version 4. Additionally, I also had to change the power connector cutout and the HDMI cutout to accommodate both older and newer versions (so that side wall would work for newer and older models).
Now there were a lot of reports of higher power consumption and heating profiles of the new Model 4. I really wanted to check out how ProtoStax would do in that arena as an enclosure/case.
Taking the modular concept further, I created a ProtoStax Cooling Kit for the Raspberry Pi enclosures (works with all flavors that are supported – Raspberry Pi A+/B+/Zero) – which consists of an extra Top Plate and short Side Wall that have cutouts for a 30mm fan, so you have a choice of fan locations – either on Top, on the Side, or both! Just swap out the existing Top Plate and/or Side Wall with the one from the “Cooling Kit” for enhanced cooling! See the photos below.
Depending on how you stack your enclosure with other ProtoStax enclosures, one or the other location may be more favorable to you. For example, if you are stacking enclosures one on top of the other, or are using a HAT, placing the fan on the side would be the ideal choice. If you are placing a Camera on the Side Wall, then the Top Fan would be the ideal choice. If you have room to spare, and want to squeeze out maximum performance, use both for enhanced cooling!
Here is a look at the ProtoStax enclosure with different “Cooling Kit” configurations:
Next up was to test the heating/cooling characteristics of the various configurations:
- Platform-only configuration. This would be similar to a Raspberry Pi without any case, except in my case (pun slightly intended! ?), the Raspberry Pi would be firmly anchored on a platform with rubber feet that elevate it, which would be better for overall cooling than the vanilla board on a table, and it would also be more appreciated by any expensive dining table with a nice finish that you might decide to prototype on! ?(See one of photos above for Platform Configuration view)
- Fully enclosed configuration without any cooling – just the vanilla enclosure. (See Photo above)
- Top Fan – ProtoStax “cooling kit” with fan mounted on top plate (See Photo above)
- Side Fan – ProtoStax “cooling kit” with fan mounted on side wall (See Photo above)
- Top and Side Fans – Both top plate and side wall have fans installed (See Photo above
The fans that I used were Toshiba D25M05P-1 – 5v fans consuming 0.07A (0.35 watts)
I used stressberry by Nico Schlömer, a very nice python based package to run stress tests (using the “stress” package) and plot the data.
You can find the source code and more information on how to run it here – https://github.com/nschloe/stressberry
In short, it runs the stress command as follows:
stress --cpu 4 --timeout 900s
and gathers the data that can be used to plot it. It starts off with a cooling down period and idling before running the stress command and then a cool off period. It also makes it super easy to collect the data and plot it!
Here are my results from different runs:
As expected, “no cooling” had the worst performance. Interestingly, the location of the fan, whether directly on top of the CPU, or off to the side, didn't really affect the cooling, and the two curves (shown above in green and orange) were practically identical. What was surprising was how much better the two fan scenario did! I did not expect it, and thought it would probably be inline with a single fan usage or perhaps marginally better.
[I will have to try the experiment again with a higher capacity single fan and see if a single higher capacity fan can match the “two fan” result.]
I also tried out the “No Fan” no cooling example with the enclosure in Platform-only configuration (called Platform No Fan below). As expected, its performance was a little bit better than the fully enclosed (No Fan) example, because it was more open and therefore had more air cooling. The “Platform No Fan” example, and how it (see orange plot) compared with the others is shown below:
Now there is one other stress test for Raspberry Pi other than the “stress” package that stressberry uses. This is the infamous cpuburn by Siarhei Siamashka. You can find it here – https://github.com/ssvb/cpuburn-arm
I found the following resource from Core Electronics to be very useful – https://core-electronics.com.au/tutorials/stress-testing-your-raspberry-pi.html. Check it out! In that, they recommend that you run the regular stress test for 10 minutes, and to ensure it doesn't throttle the CPU or hit 80+ temperatures before you try the cpuburn test, which can be very punishing!
Now, the “Two fan” cooling seemed good enough to be able to withstand the dreaded cpuburn test – I had to try it! ?
I ran the following for 10 minutes:
while true; do
   date;
   vcgencmd measure_clock arm;
   vcgencmd measure_temp;
   vcgencmd get_throttled;
   sleep 10;
done
&
./cpuburn-a53
[In addition to what the Core Electronics guys were doing, I added keeping track of time and also the get_throttled status to know directly if any throttling was going on beyond looking at the frequency. ]
This would run cpuburn-a53 in the foreground, while the background would print the date, the CPU frequency, the CPU core temperature, whether the CPU was being throttled, every 10 seconds.
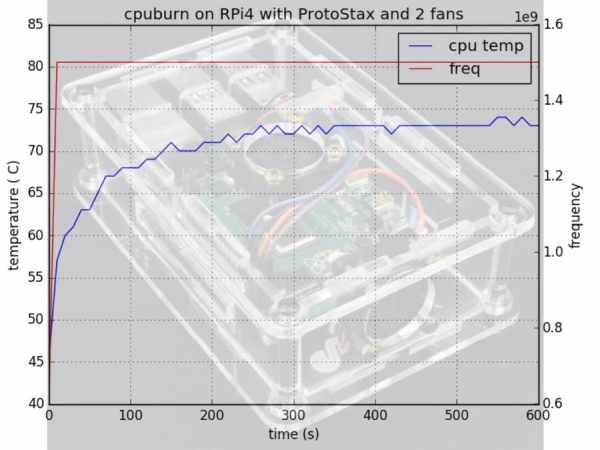
I collected the raw data and then plotted the CPU core temperature over time, and frequency over time (with secondary y-axis) using matplotlib. Here are the results:
You can see that the temperature remains well below 75ºC. Btw, there was NO CPU throttling at all, as expected from the CPU core temperature profile. I've attached the raw data below, which includes throttling data. I have tried cpuburn on a vanilla Raspberry Pi without any cooling, and it very quickly hit throttling temperatures and became unresponsive, so be very careful before you try it!!!!!
This also prompted me to try out cpuburn using a single fan (I used the Top Fan option). As expected, the temperatures creeped higher and there was some amount of throttling going on.
Source: Raspberry Pi 4 – Conquering cpuburn with ProtoStax & 2 Fans