
ABSTRACT
With the continuous advancement of Internet of Things (IoT) technology, wireless sensor network applications in agriculture are becoming increasingly popular. These networks are primarily utilized to monitor crucial agricultural parameters like temperature, humidity, soil moisture levels, nitrite content, and groundwater quality. The collected data is transmitted to a remote station for analysis, facilitating the development of decision support systems.
This paper presents the deployment of a wireless visual sensor network tailored for precision agriculture, focusing on weed monitoring in paddy fields using Raspberry Pi. Visual sensor nodes utilize Bluetooth 4.0 for data transmission to the base station, which then forwards it to the remote station via IEEE 802.11 a/b/g/n standard. Solar cell batteries power both the sensor nodes and the base station.
At the remote station, image preprocessing techniques are applied to eliminate soil background, followed by the extraction of various shape features. Classification of paddy crop and weeds is performed based on these shape features, employing random forest and support vector machine classifiers. The study also includes insights and findings from experiments conducted in a small paddy field setup.
This system holds promise for improving crop production by providing timely alerts to farmers regarding weed presence, enabling prompt action to mitigate weed infestation.
I. INTRODUCTION
In recent times, the agricultural sector has witnessed emerging trends, particularly with advancements in wireless sensor networks. This progress has led to significant reductions in both size and cost of sensor boards, rendering them highly favored in precision agriculture. Precision agriculture, characterized by the application of science and technology to optimize crop production, has become imperative due to the escalating global population. To address the pressing need for increased food production, farmers increasingly turn to precision agriculture methods. This approach involves leveraging wireless sensor networks to remotely observe, analyze, and manage various agricultural practices across diverse sectors including horticulture, animal farming, and viticulture.
The primary objective of employing wireless sensor networks in agriculture is to facilitate site-specific crop management, thereby curbing excessive use of resources such as water, fertilizers, insecticides, and herbicides. For instance, sensor nodes affixed to drip irrigation systems continuously monitor soil moisture levels, triggering irrigation only when the water levels fall below a specified threshold, thus minimizing water wastage. Moreover, these networks can gather and analyze soil parameters over time to determine the most suitable crops for specific land plots, further enhancing productivity and quality.
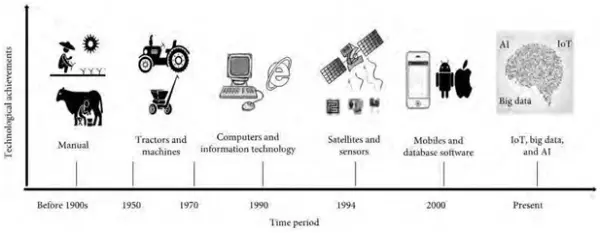
Wireless sensor networks also play a crucial role in monitoring various agricultural parameters including temperature, humidity, leaf wetness, and soil moisture levels to predict and preempt the onset of pests or crop diseases. Predictive modeling for livestock or crop diseases can be achieved through the utilization of soft computing or data analytics techniques. The roots of precision agriculture trace back to the mid-19th century, as illustrated in Figure 1, and since then, agricultural technologies have undergone significant evolution and refinement.
Sensors deployed in the agricultural sector, as well as related fields, continuously generate substantial volumes of data. These data serve as inputs for soft computing or data analytical applications, contributing to the advancement of research in precision agriculture. The integration of soft computing techniques and wireless sensor networks (WSNs) offers insights into various agricultural challenges such as weather forecasting, crop and livestock disease management, irrigation, and farmland management. Timely insights derived from these technologies enable farmers and crop producers to enhance yield and crop production, thereby bolstering revenue generation.
WSNs in farmland deployment are typically categorized into three architectures based on node movement:
1) Static Architecture: Nodes are stationed at fixed locations and maintain their positions throughout the system's lifespan. An example is an irrigation management system.
2) Mobile Architecture: Nodes are in continuous motion across the field, such as sensors mounted on tractors or drones.
3) Hybrid Architecture: This setup combines both mobile and stationary nodes within the system.
Moreover, WSN architectures are further classified into homogeneous and heterogeneous architectures based on sensor node hardware configurations. In homogeneous architecture, all nodes possess similar capabilities, whereas in heterogeneous architecture, nodes exhibit varying capabilities.
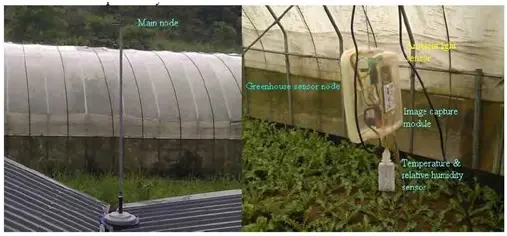
Wireless Visual Sensor Networks (WVSNs) facilitate remote visual inspection of crops. Visual sensors distributed throughout agricultural land capture periodic images, which undergo processing and analysis to support decision-making processes. WVSNs are commonly employed for monitoring plant growth and detecting diseases or pests affecting crops. Despite the popularity of WSNs in precision agricultural applications, there is a scarcity of studies implementing WSNs with visual or image sensors. Figure 2 illustrates the implementation of WVSN in a greenhouse for plant monitoring using the ZigBee transmission technique.
1. SUMMARY OF MAIN CONTRIBUTIONS
One aspect crucial to precision agriculture is the provision of site-specific crop management, which encompasses various tasks such as monitoring soil and environmental parameters within a field. Additionally, it involves the surveillance of crops for pests, including weeds. Automatic weed detection is highly desirable for effective crop monitoring. In implementing a Wireless Sensor Network (WSN) for precision agriculture, especially in developing nations like India, cost-effectiveness and affordability are paramount concerns.
Raspberry Pi boards offer a solution to these concerns as they are low-cost, readily accessible, and programmable using open-source languages like Python. With built-in wireless technologies such as Wi-Fi and Bluetooth, Raspberry Pi can seamlessly integrate into and contribute to a wireless visual sensor network. Thus, this paper undertakes the pioneering task of exploring the potential of Raspberry Pi as visual sensor nodes for weed monitoring in paddy crops. Our contributions are succinctly outlined as follows:
WVSN implementation: Our findings indicate that Raspberry Pi exhibits promising potential as visual sensor nodes for weed detection, offering possibilities for automating weed detection processes within precision agriculture.
Classification of paddy crop and weed: Our demonstration highlights the utilization of region-based shape features such as Hu's invariant moments [4], geometric shape features like perimeter, and size-independent shape features for the classification of paddy crops and weeds.
2. RELATED STUDY
Numerous studies in the literature have applied wireless sensor networks (WSNs) to precision agriculture.
A. WSN FOR PREDICTION/MONITORING CROP FOR DISEASES/PESTS
In study [5], a Wireless Visual Sensor Network (WVSN) was deployed within a vineyard to identify any instances of disease or pests impacting the grape crop. Study [6] described the installation of a WVSN aimed at monitoring pest traps within a greenhouse. The WVSN setup autonomously captured images of the pest traps and transmitted them to a remote station for analysis, enabling the determination of insect density. Upon reaching a predefined threshold, an alarm would be triggered.
In research [7], a Wireless Sensor Network (WSN) was employed in a potato farm to oversee crop conditions and establish a decision support system based on monitored parameters such as temperature, humidity, and leaf moisture levels. This system aimed to predict the potential development of Phytophthora, a fungal disease known to affect potato crops.
Additionally, in study [8], the correlation between Bud Necrosis Virus and weather patterns in groundnut crops was investigated using a wireless sensor network. This collaborative project, supported by Indo-Japan collaboration, involved the measurement of various environmental factors including sunshine hours and wind speed. Data mining techniques were applied to evaluate empirical results obtained from the study.
B. WSN FOR SENSING IMPORTANT ENVIRONMENTAL PARAMETERS
In [9], a proposal for an agricultural monitoring system utilized a Wireless Sensor Network (WSN) to capture essential parameters such as soil data and other environmental information crucial for crop growth. Complementing this setup, Closed Circuit Televisions (CCTVs) were strategically positioned to capture field images, while GPS systems were employed to ascertain sensor locations.
In [10], the deployment of a WSN in an agricultural setting was elucidated. This WSN featured a gateway with GPRS capability, consolidating data from sensors and transmitting it to a remote station via a TCP/IP-based communication protocol. The remote station hosted a web application for comprehensive information management, allowing end-users to monitor environmental conditions and make informed decisions.
[11] introduced a WSN tailored for weather forecasting, where each node detected parameters like temperature, humidity, and soil moisture. A Raspberry Pi 3 served as the network gateway, forwarding sensed data to a remote server, which processed it for weather prediction.
[12] outlined the deployment of a wireless sensor network to measure crucial environmental parameters including light intensity, humidity, temperature, and soil moisture. The network featured coordinators bridging the distance between sensor nodes and the base station, with routers extending network coverage. ZigBee was employed as the communication protocol.
[13] detailed a cost-effective WSN implementation, utilizing microprocessor STM32L152, wireless modules MRF24J40, and sensors programmed via Keil-C. Performance metrics such as Read-Range, Received Signal Strength Indicator (RSSI), Packet Reception Ratio (PRR), and Link Quality Indicator (LQI) were assessed, with results compared to commercially available products, demonstrating potential for real-world application in agriculture.
[14] described a wireless sensor network designed to gauge soil quality parameters like conductivity and acidity, enabling the determination of fertilizer requirements at regular intervals.
In [2], a study explored different WSN architectures viable for agricultural environments, with a focus on the Indian agricultural landscape, emphasizing the necessity for cost-effective deployment.
[15] documented the implementation of a WSN dubbed COMMONSense Net in Tumkur district, Karnataka, collaborating between Dutch and Indian governments to develop a decision support system predicting water requirements in the semi-arid region.
[16] showcased a WSN deployment in a Sicilian vineyard to monitor vine growth and micro-climate conditions, optimizing pesticide and soil treatment schedules to enhance grape quality while reducing operational costs.
[17] presented a low-cost WSN aimed at conserving water in agriculture, employing actuation network technology, fuzzy rule sets, and numerical soil parameters to devise context-aware and optimized irrigation schedules.
[18] introduced a Received Signal Strength Indicator (RSSI)-based distributed Bayesian localization algorithm to mitigate interference in large agricultural areas, particularly suitable for precision farming applications.
[19] offered a review of energy-efficient WSN implementations in precision agriculture, comparing various wireless communication protocols and assessing state-of-the-art technologies, while addressing limitations and challenges for future design considerations.
[20] proposed an air-ground monitoring system comprising a WSN deployed in fields for long-term data acquisition, complemented by a micro unmanned aerial vehicle (mUAV) equipped with remote sensing (RS) sensors to gather field images. A ground center station with 3G/4G technology received data from the mUAV for analysis guiding agricultural practices.
[21] introduced a context-aware WSN approach, optimizing fault tolerance by grouping sensors likely to collect similar environmental parameters, thus prolonging network lifespan by transmitting data only from selected sensors.
[22] detailed a setup where environmental parameters were sensed and transmitted via Wi-Fi to an ESP826612E, forwarded to a Things Speak Server, and an Android phone application.
[23] leveraged Internet of Things (IoT) technology to manage crop water stress, implementing an IoT-based WSN to alert farmers about irrigation needs.
3. METHODOLOGY
A. RASPBERRY PI CAMERA
The remarkable success of Raspberry Pi boards paved the way for the development of the Raspberry Pi camera module v1, designed to complement the functionality of Raspberry Pi boards. Released in 2013, the camera module v1 boasts several specifications detailed in TABLE 1. This compact, high-definition camera operates on low power and is equipped with a flat flexible cable for connection to the CSI (Camera Serial Interface) connector.
In 2016, the camera module v2 was introduced, offering enhancements over its predecessor. Both iterations are available in visible light and infrared versions. Various programming libraries cater to image processing using the Raspberry Pi camera, facilitating diverse applications. In this study, Python APIs were utilized to capture and process images from the Raspberry Pi camera.
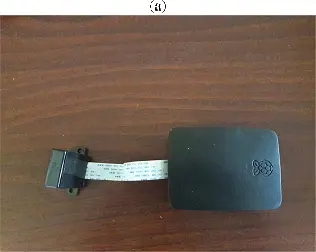
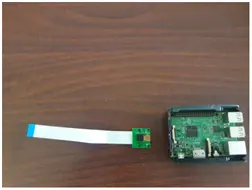
When employing the Raspberry Pi in outdoor settings, it's advisable to shield the board to safeguard against external elements such as wind and water. FIGURE 3a and FIGURE 3b depict the Raspberry Pi 3 model B alongside the camera module v1, illustrating the setup without and with the protective shield, respectively.
B. NETWORK ARCHITECTURE AND SENSOR NODES
The setup incorporated Raspberry Pi 3 Model B as sensor boards, coupled with the Raspberry Pi Camera Board V.1 serving as an image or visual sensor. Acting as the base station, another Raspberry Pi 3 Model B board was utilized. These Raspberry Pi devices operated on the Raspbian Stretch operating system. Notably, the Pi sensor board was powered by solar energy.
Raspberry Pi 3 Model B supports Ethernet, Bluetooth 4.0, and Wi-Fi technologies. Bluetooth facilitated communication between sensor nodes and the base station. Meanwhile, Wi-Fi was employed for communication between the base station and the remote station. Specifically, in this investigation, a laptop functioned as the remote station, utilizing a mobile hotspot for Wi-Fi connectivity.
4. BLUETOOTH 4.0
In 2011, Bluetooth 4.0, also referred to as Bluetooth Low Energy (BLE), was introduced. Operating within the 2.4 GHz band like classic Bluetooth, BLE distinguishes itself by entering sleep mode when not in use. This feature significantly minimizes power consumption, utilizing only 3% of the energy consumed by Wi-Fi. Consequently, BLE stands out as a highly efficient and cost-effective alternative to classic Bluetooth. Employing an adaptive frequency hopping technique, BLE dynamically selects channels from a pool of 79, effectively mitigating interference issues [24].
D. DESIGN OF THE SYSTEM
The setup comprised stationary nodes positioned at fixed coordinates. A critical aspect of implementing wireless visual sensor networks (WVSNs) is determining the placement of sensor nodes within the field and deciding the optimal number required. WVSNs encompass two distinct coverage areas: radio coverage area, denoting the range covered by the communication technology employed, and sensing coverage area, representing the region observable by the visual or image sensor. Due to factors such as cost constraints and the topography of the land, it is impractical to achieve full coverage of the entire field using visual sensors. However, this limitation is acceptable when deploying WVSNs for monitoring crops for pests like weeds or diseases since such threats typically spread uniformly across the field. Therefore, it is improbable for these threats to go undetected due to uncovered regions.
This study endeavors to minimize the number of such uncovered regions. The field where the system was implemented encompassed an area of approximately 10 square meters. The camera was positioned 2 meters above the ground, facing downwards towards the crops, resulting in an approximate square sensing coverage area of 2m x 2m. An effective coverage and deployment strategy are essential for optimal resource allocation within a WSN, thereby reducing network costs. Random deployment of visual sensor nodes can lead to certain regions being either densely or sparsely covered, resulting in the same target being captured by multiple visual sensors. Consequently, the information gathered or captured may be redundant. Thus, we utilized the formula proposed by [5] to determine the number of sensors required to cover an area of approximately 10 square meters.
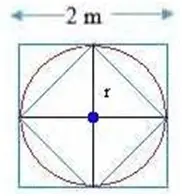
In [5], the sensing area is assumed to be circular. Therefore, to approximate the area of a circular sensing region from the given square sensing area, the following method was employed: a circle with radius ‘r' is inscribed within the square, as illustrated in FIGURE 4. Inside this circle, another square is inscribed. The area of the circle is then determined as the average of the areas of the inner and outer squares. The area of the inner square is calculated as the sum of the areas of the four triangles, thereby yielding the sensing area ‘S'.
2. DATA STORAGE
The images captured by nodes B and D were transmitted to the base station and stored in a queue managed by RabbitMQ [28], an open standard message brokering system known for its reliability and persistence. This means that the queue remains intact even after system restarts. RabbitMQ operates on the Advanced Message Queuing Protocol (AMQP), enabling compliant clients to interact with conforming messaging middleware brokers. These brokers receive messages from producers, also referred to as publishers, as they publish messages, while consumers are applications that receive these messages. Brokers facilitate the communication between producers and consumers within the system.
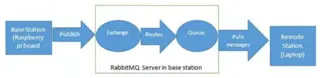
Messages can be either pushed to consumers or pulled from brokers by consumers. In this investigation, the base station dispatched messages to a RabbitMQ server residing on the same machine (base station), while the remote station retrieved these messages. The utilization of a message brokering system facilitated asynchronous communication between the base and remote stations. Consequently, the remote station did not need to be constantly operational or available to the base station. Instead, it consumed messages from the queue on the base station every other day. The operational mechanism of the message queue in this context is depicted in FIGURE 7. Exchanges serve as intermediaries that receive messages and route them to one or more queues. In this study, a direct exchange was employed. Upon consumption of messages from the queue by the remote station, acknowledgments were dispatched to the RabbitMQ server, which subsequently deleted the consumed messages from the queue. This open standard provides considerable flexibility for application developers to design applications tailored to their specific needs. The captured images are sized at 2592 X 1944 pixels and are stored in PNG (Portable Network Graphics) format. Sample images captured by the Raspberry Pi sensor nodes are illustrated in FIGURE 8a and FIGURE 8b.
4. SHAPE FEATURE EXTRACTION
Shape features play a pivotal role in distinguishing between crops and weeds. These features can be extracted from individual leaves or the entire plant. In our investigation, we focused on extracting shape features from the entire plant. It's noteworthy that grass-type weeds and paddy plants share a familial resemblance, thereby exhibiting similar shape features. Additionally, sedges, categorized as weeds, bear close resemblances to paddy crops in terms of shape features. Given that plant shapes undergo variations as they mature, relying solely on a single shape feature may prove insufficient for discriminating between paddy crops and weeds. Hence, our study incorporates various shape features, including chain codes, size-independent shape descriptors, and moment invariants, to construct an integrated model for shape feature analysis.
A. MOMENT INVARIANT FEATURES
A critical consideration in shape feature extraction involves identifying features that remain invariant under rotation, scaling, and translation. The concept of utilizing moments in shape feature extraction was pioneered by Hu [4], who employed algebraic invariants. Since then, it has become a fundamental aspect of shape analysis. Hu's moments are instrumental in extracting region-based shape features.
To extract plant objects from images captured by the Raspberry Pi, a Connected Component algorithm [29] was employed, as depicted in FIGURE 9b and FIGURE 9c. Successive erosion and dilation operations were applied to mitigate potential overlap. For each identified plant object in the image, seven of Hu's moments were computed. These moments served to characterize the plant object, aiding in the differentiation between paddy crops and weeds. Consider a binary image f(x, y) representing a plant object, where x and y denote pixel coordinates within an MXN dimensional space. In this representation, plant objects are denoted by pixels with a value of one, while the soil background is represented by pixels with a value of zero.