
Monitor air quality on a street-by-street level using Android Things, Google Cloud IoT, and taxis!

Story
When my family moved to Lima, Peru a few months ago, I was excited at the prospect of being able to do my daily run along the seaside.
Unfortunately, I need to cross a few busy streets to get from my house to the seaside, and I could really feel a tickling in my throat after running through these parts.
Now from an air quality perspective, Lima is not too bad. The near constant Pacific breeze makes the air pretty clear, but what Lima also has is a lot of very old diesel vehicles on the roads that make visible clouds of smoke when they go chugging through the streets.
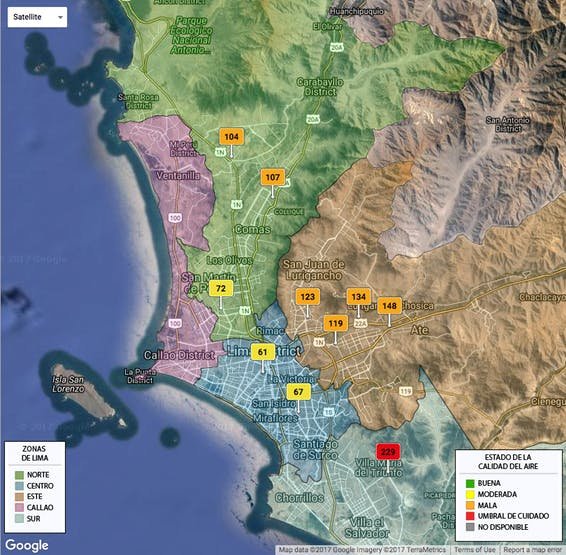
Air quality monitoring is a hot topic these days. No wonder, with so many recent studies showing a strong correlation between certain types of air pollution and negative health effects. However, most air quality monitoring happens at a few stations that are few and far between. Very little is understood about how pollution levels vary within a city on a street by street level, even though recent studies indicate that this might be incredibly important.
This got me thinking about how much the air quality could vary on a street-by-street level, and how to measure it.
What if we used taxis to collect air quality data across the city in near realtime? The great thing about Lima is that it has an abundance of taxis, and the taxis go everywhere. Even better is that almost every single taxi in Lima has the exact same hollow vinyl taxi sign stuck to its roof.

It's also probably not an unreasonable supposition that I can convince a few Lima taxistas to earn a little bit of extra money by putting my identical looking signs on their taxis instead.
NOTE: Of course, your particular situation in your city may be quite different (different signs, tighter regulation, etc). You may have to work with a particular company, but I’m sure there’s a solution there somewhere.
So here’s the project in broad strokes:
- Design an Android Things based datalogger with a host of environmental sensors, GPS, and battery.
- Mount the electronics inside a Taxi sign.
- Write some software for Android Things to regularly collect data, and upload the data to Google Cloud Platform for later analysis.
- (Later analysis) Make pretty pictures with the data that can maybe help us understand more about pollution on a street by street level.
On a larger scale (with even more taxis) we could even collect enough data to build pollution maps that let us better understand how pollution may affect some areas more than others.
In this project we'll be logging: longitude, latitude, temperature, humidity, pressure, and (most importantly) air borne particulate counts (PM10 – particles with a diameter between 2.5 μm and 10 μm, PM2.5 – fine particles with a diameter of 2.5 μm or less).
Here’s a high level view of the data flow for this project:
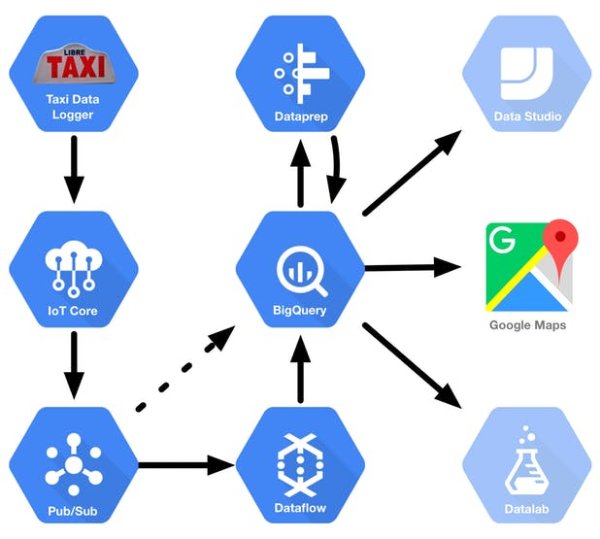
- The Android Things based Taxi Datalogger collects data from it’s sensors. Whenever it has network connectivity, it tries to push its sensor data (as JSON) to Google IoT Core.
- Google IoT Core ensures that only authorized devices can push data (using public key cryptography). Device data is published to a Google Pub/Sub topic.
- Google Dataflow reads in the sensor data from a Pub/Sub topic and adds it to a BigQuery table (in theory it can do a lot more pre-processing too). For the purpose of this project, I also have a script that pulls entries from Pub/Sub and inserts them into the BigQuery table.
- Once the data is in BigQuery, you can analyze it directly, but more likely you’ll want to pre-process it. You can do this using either your own BigQuery queries, or more interactively using Google’s Dataprep tool.
- Once your data is ready, you can use any number of tools to analyze and present your data (including Google Data Studio and Google Datalab). For this project we'll keep it simple and just use Google Maps.
The analysis part is of course hugely open ended, and depends on the data you collect, and what you want to do with it. I'm only showing a few simple examples of building heat maps using Google Fusion Tables and the Google Javascript API, but there’s so much more you could do.
So, want to try this yourself? Here’s how!
Part 1 – Assembling the Air Quality Monitor
Depending on the enclosure you have (eg. your taxi sign) the steps for mounting your hardware will be different. However, it should be connected as shown in the Fritzing diagram below.
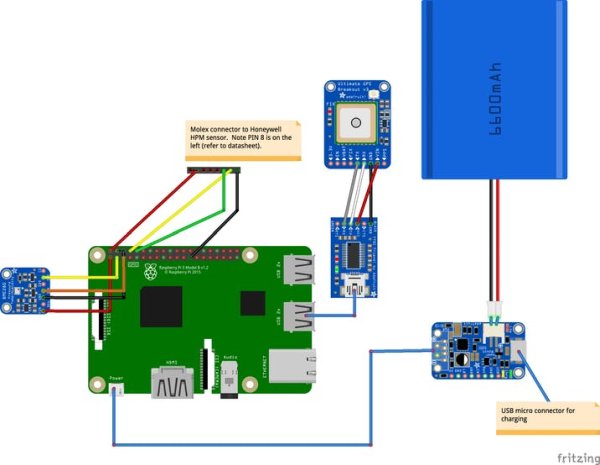
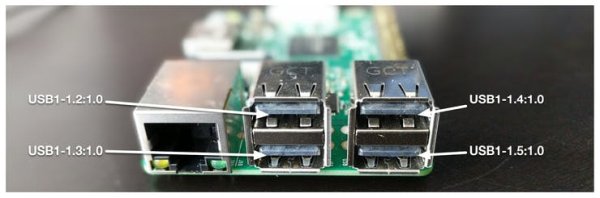
It’s important to note, that you need to make sure the USB port you attach the USB FTDI adapter to matches the one used in the code. The code currently expects the FTDI adapter to be plugged into “USB1-1.4:1.0” (you can change it, if you need to).
Note: I wanted to use the Powerboost 1000C from Adafruit with a LiPo battery pack, but it couldn’t arrive in time (issues at the border). I just used an external USB phone battery in the meantime. I still recommend using the Powerboost 1000C, since it will let you charge or operate from supply current while powering your device at the same time. This is useful if you ever want to install a fixed power connection for long term operation (12v to 5v).
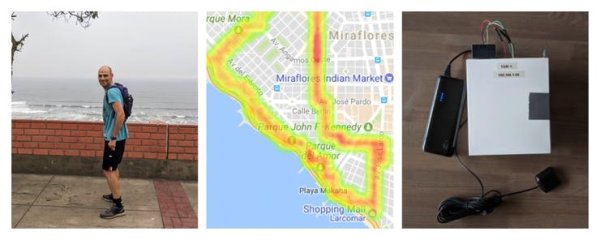
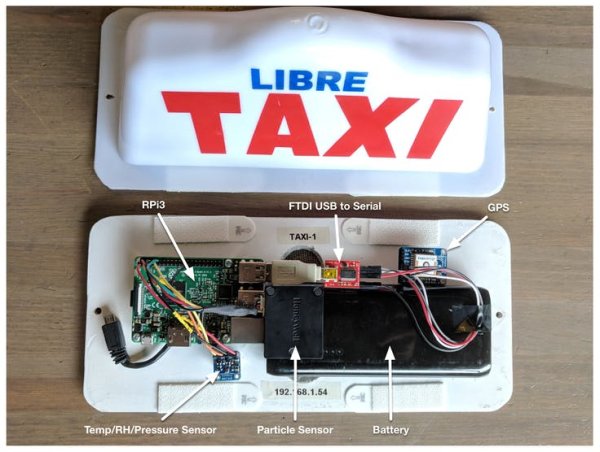
Here’s a picture of how I assembled the taxi sign, and a video explaining it a bit more.
Here are a few design principles I tried to keep in mind:
- Ensure good ventilation in your enclosure, since the sensors need good airflow to get good readings. I added ventilation holes to the bottom of my enclosure.
- Try to minimize the effects of weather on your electronics. I used standoffs to keep the electronics off the bottom, and nylon screening over the ventilation holes.
- Orient your particle sensor perpendicular to the airflow. Most particle sensors have their own internal fan to draw air into the sensor. You may get inconsistent readings if air is forced into the sensor.
A word on particle sensors: The one part that can be a bit hard to find is the particle sensor, since it’s not (yet) part of the sensors commonly available from hobbyist shops like Adafruit. I chose the Honeywell sensor simply because it was quickly available from Mouser, so I can’t speak to its advantages or disadvantages. The reason we care so much about a particle counter, is that airborne particulate matter and in particular PM2.5 (particles less than 2.5 micrometers in diameter) seems to be one of the worst pollutants in terms of adverse health effects (https://en.wikipedia.org/wiki/Particulates). There’s a good deal of information available about various particle sensors (and other related air quality information) here: http://aqicn.org/sensor/.
Part 2 – Setting up the Google Cloud Service Backend
Before we setup our device, we need to setup our project on Google Cloud Platform so that our device has somewhere to send its data when it connects. I walk you through the setup process in the overview video, and in the instructions written out below. I suggest watching the video, as instructions for using things like cloud services don’t always age well (the UI can move around), while a video will still give you a good overall idea.
Caution: Note that while our project should not be expensive to run, Google Cloud Platform does cost money to use, and following the instructions below will cost you some (but hopefully not much) money.
Step 1 – Create your project
- Go here: https://console.cloud.google.com
- Create a new project. You can name it whatever you want.
Step 2 – Create credentials
- Create an API key – Name it something like ‘Browser Key’, as this is how we’ll access the Google Maps Javascript API when we display collected data on a webpage.
- Create an OAuth2 client ID – Similarly name it something like ‘Browser Client ID’, as this is what we’ll use when we display collected data using a webpage.
- Create a Service account ID – This account will be needed to run any scripts or commands from the command line (if not using Google Cloud Shell). Download the credentials as JSON. You may need them later.
Step 3 – Enable APIs
- Make sure the Google Maps Javascript API is enabled for your project
Step 4 – Setup Google Pub/Sub
- Create an ‘events’ topic.
- Create a subscription for the ‘events’ topic called ‘storage‘, with the acknowledgement timeout set to 600 seconds (the maximum).
Step 5 – Setup Google IoT Core
- Go here: https://console.cloud.google.com/iot
- Create a registry named ‘taxis’.
- Set the telemetry pub/sub topic to projects/<project-name>/topics/events
- Use whichever cloud region you want.
- Make sure the MQTT protocol is enabled.
- Leave the CA blank.
Step 6 – Setup Google BigQuery
- Create a dataset named tax_sensor_data
- Create a new table named log_entries using the following JSON schema:
[

{ "mode": "REQUIRED", "name": "deviceId", "type": "STRING" },

{ "mode": "REQUIRED", "name": "time", "type": "TIMESTAMP" },

{ "mode": "REQUIRED", "name": "latitude", "type": "FLOAT" },

{ "mode": "REQUIRED", "name": "longitude", "type": "FLOAT" },

{ "mode": "REQUIRED", "name": "accuracy", "type": "FLOAT" },

{ "mode": "NULLABLE", "name": "altitude", "type": "FLOAT" },

{ "mode": "NULLABLE", "name": "verticalAccuracy", "type": "FLOAT" },

{ "mode": "NULLABLE", "name": "temperature", "type": "FLOAT" },

{ "mode": "NULLABLE", "name": "humidity", "type": "FLOAT" },

{ "mode": "NULLABLE", "name": "pressure", "type": "FLOAT" },

{ "mode": "NULLABLE", "name": "pm25", "type": "INTEGER" },

{ "mode": "NULLABLE", "name": "pm10", "type": "INTEGER" }

]
Tada! You're all set!
Part 3 – Setting up the Air Quality Monitor (Taxi Sign) Software
Basic Setup
Flash the latest version of Android Things to your RPi3 board, boot your device, and ensure you can connect to the device via ADB. Instructions on flashing the RPi3 and connecting via ADB can be found here: https://developer.android.com/things/hardware/raspberrypi.html
Now because we’re also going to need to sync the data from the Taxi sign periodically via WiFi, you’ll also need to follow the instructions on the same page as above, to configure your device to be able to connect to a few WiFi Access Points (APs). I added credentials for my home WiFi and the WiFi hotspot point I have configured on my Android Phone.
Freeing up the Serial Port
Next, this project uses the Raspberry Pi’s serial port in order to communicate with our particle sensors. Unfortunately, by default the Raspberry Pi uses serial port as a Linux console. We need to change this, and free it up for our use. Fortunately, assuming you can connect to your device via ADB, we can do this from the command line.
Restart ADB to run as the root use by default:
$ adb root
You need to reconnect to adb after issuing the `adb root` command.
adb connect <address-of-your-RPI>
Mount the boot partition and copy the kernel arguments (cmdline.txt) to your machine.
$ adb shell
rpi3:/
rpi3:/
rpi3:/
rpi3:/
$ adb pull localboot/cmdline.txt
Now edit the cmdline.txt file to remove the part that reads ‘console=serial0,115200‘, push it back to the device, and then reboot it.
nano cmdline.txt
adb push cmdline.txt /data/local/tmp/boot/cmdline.txt
adb reboot
Download, Build, Install, and Configure the Application
Next, clone the application from Github and open the application in Android Studio.
$ git clone https://github.com/jpuderer/Taxi-Datalogger.git
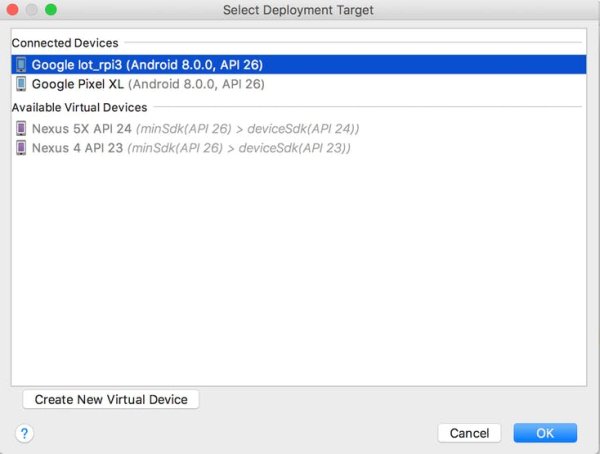
When you open the project in Android Studio, wait for the application to sync. Click ‘Run App’ from the Run menu, which should install the application. If prompted, make sure to select the iot_rpi3 device as the device to install to:
After installing the app on the device (for the first time), reboot the device (either unplug and replug it, or type ‘adb reboot’ from the command line). This is required for the application to be granted some of its requested (dangerous) permissions (see here for details). You’ll need to reconnect ADB once the device has rebooted.
If everything’s working so far, then all that’s left is to provision the device to communicate with Google IoT Core.
Run the following commands, replacing <PROJECT_ID>, <REGION>, <REGISTRY_ID> and <DEVICE_ID> with your own versions.
$ adb shell am startservice \

-a net.jpuderer.android.things.taxidatalogger.CONFIGURE \

-e project_id <PROJECT_ID> -e cloud_region <REGION> \

-e registry_id <REGISTRY_ID> \

-e device_id <DEVICE_ID> \

net.jpuderer.android.things.taxidatalogger/.cloud.CloudPublisherService
Provision Google IoT Core with your Device Credentials
Now if everything has gone well to this point, the device should be completely setup. However, it still won’t be able to push data to Google IoT Core, because Google IoT Core doesn’t know about your device. See the below exception from the log (eg. adb logcat).
10-19 03:00:12.620  1373  1398 E CloudPublisherService: Could not create MQTTPublisher. Will try again later
10-19 03:00:12.620  1373  1398 E CloudPublisherService: java.lang.IllegalArgumentException: Could not initialize MQTT
In order for Google IoT Core to recognize our device, we need to add the device to Google IoT Core.
To add your device, you’ll need to grab the public certificate which should have been generated on the device, so download the certificate from the device.
adb pull /sdcard/cloud_iot_auth_certificate.pem
Open the Google IoT Core Console for your project: https://console.cloud.google.com/iot
If you followed the earlier steps for setting up Google Cloud Platform, you should already have a registry named ‘taxis’.
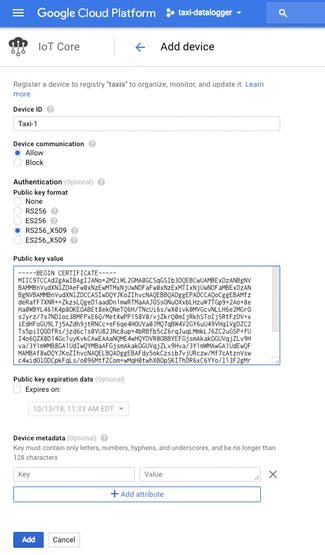
Click the ADD DEVICE button, to create a new device. You’ll need to give the device a name, select the RS256_X509 key format, then cut and paste the contents of the certificate file you just downloaded from the device into the box marked “Public key value”. Leave everything else as the default, and click the ‘Add' button.
Finally, reboot the device one last time to make sure that everything is working correctly.
NOTE: You may also see exceptions in the log about failing to connect because of a not-yet-valid certificate. This is normal. You just need to wait for Android to get a valid time from the network.
If everything is working correctly, you should see periodic messages in the logs (eg. adb logcat) that look similar to those shown below:
Publishing: {"deviceId":"Taxi-1","time":1508415139,"latitude":-12.105056666666666,"longitude":-77.04408166666667,"accuracy":6,"altitude":0,"verticalAccuracy":0,"temperature":21.346969604492188,"humidity":64.81196594238281,"pressure":616.6408081054688,"pm25":"20","pm10":"21”}
NOTE: The application only logs data when it has a GPS fix. You may need to attach the GPS antenna (shown in the assembly video above) to get a fix while testing in your workshop (or desk, shed, basement, etc.).
That’s it! If you’ve followed all the steps so far, your Taxi Datalogger should be ready to go for a ride!
Super geeky technical side note: Google IoT Core uses public key cryptography that ensures that only authorized devices can connect. What's interesting in our case is that we’re generating the key pair on the device (in the Android keystore), and only copying off the public key (instead of generating the key somewhere else, and copying the key to the device). The advantage of this approach is if the Android Things board we’re using has a hardware backed keystore (the RPI does not, but others do), the private key is irrevocably bound to that particular device, and cannot be extracted without a significant effort on the part of some Bad Guy (TM). Even better, is that you can provision the key at creation time to stop working if someone hacks or roots your device. This makes it really hard for someone to steal one of your devices once it’s in production and use it maliciously against you.
Part 4 – Collecting the Data
So now, let’s collect some data.
Yay! Field trip!
Once you’re done collecting data, make sure your datalogger gets internet connectivity somehow, so it can start uploading its data. Unless your datalogger had a connection all along, in which case your data should have already been pushed to Google IoT Core.
Part 5 – Analyzing the Data
Now that we have some data, we need to process it somehow, and see if we can’t learn something from it.
Getting the Sensor Data into BigQuery
Now that we’ve got this data (somewhere), we need to get it into BigQuery so we can actually do something with it.
The exact somewhere our data is right now, is queued up in the (storage) Pub/Sub subscription we created early. Queued messages are stored for 7 days, so we at least have some time to do something about them.
There are two basic options for moving data from Pub/Sub into BigQuery. We can use Google's Dataflow service to move the data (https://cloud.google.com/dataflow/), or we can simply run a script that does it for us (pulls from the Pub/Sub subscription and inserts it into BigQuery).
For simplicity’s sake, we’ll choose the later option and run a Python script that does this for us.
NOTE: While Dataflow promises a highly-scalable solution for processing data, it’s more than we need to get into right now. You can use one of the predefined Google templates for streaming data from Pub/Sub to BigQuery here, but it only works with live data (as it comes in), and is somewhat expensive to run (it consumes a lot of resources). Still, worth looking at if you scale something up to beyond the “merely a toy” stage.
The easiest way to run some scripts and host our temporary webpage (further down on the page), is to use the Google Cloud Shell. Google Cloud Shell is basically just a shell on a temporary VM instance with all the necessary Google Cloud Platform tools already preinstalled. Note that when using Google Cloud Shell, only your home directory persists across invocations.
Click below to launch one:
https://console.cloud.google.com/home/dashboard?cloudshell=true
Once you have a Cloud Shell open, do the following:
Setup a Pyton virtualenv to run your scripts (Note: that you will need to re-run the activate step each time after your cloud shell terminates)
$ virtualenv taxi-datalogger-env
$ source taxi-datalogger-env/bin/activate
Clone the project repository and go to the scripts directory:
$ git clone https://github.com/jpuderer/Taxi-Datalogger.git
$ cd Taxi-Datalogger/scripts
Edit the setup.yaml file to correspond to your project (with whatever editor):
$ nano setup.yaml
Install the script dependencies:
$ pip install -r requirements.txt
Finally, run the script to pull events from your pub/sub subscription and publish them to the BigQuery table:
$ ./pull_taxi_pubsub.py
You should see the script pulling events from the subscription:
Pulled: {"deviceId":"Taxi-1","time":1508456006,"latitude":-12.105038333333333,"longitude":-77.04422833333334,"accuracy":6,"altitude":0,"verticalAccuracy":0,"tempe
rature":23.744205474853516,"humidity":58.5398063659668,"pressure":1001.915771484375,"pm25":"25","pm10":"27"}
Pulled: {"deviceId":"Taxi-1","time":1508455946,"latitude":-12.10496,"longitude":-77.04428166666666,"accuracy":6,"altitude":0,"verticalAccuracy":0,"temperature":23
.699161529541016,"humidity":57.91984176635742,"pressure":1001.7929077148438,"pm25":"27","pm10":"29"}
Pulled: {"deviceId":"Taxi-1","time":1508455976,"latitude":-12.10502,"longitude":-77.04423333333334,"accuracy":6,"altitude":0,"verticalAccuracy":0,"temperature":23
.724185943603516,"humidity":57.979087829589844,"pressure":1001.8703002929688,"pm25":"26","pm10":"28”}
The script will run forever (waiting for more events) until you stop it. Just wait until you have all the data you want (it should stop printing if you're not logging any more data), and type Ctrl-C to stop it.
Now, if we’re lucky, all our data should be in BigQuery ready and waiting for the next step.
Protip: Sometimes, you may wish to start fresh and clear existing data from your BigQuery table. Fortunately, this is easy to do from the Cloudshell, and a copy of the required schema is already in the scripts directory:
$ bq rm <your-project>:taxi_sensor_data.log_entries
$ bq mk --schema entries_schema.json <your-project>:taxi_sensor_data.log_entries
Preprocessing the Data
It’s tempting to take the data we’ve logged and immediately try to map it. It’s tempting, but it won’t tell us much. Most data needs some kind of preprocessing.
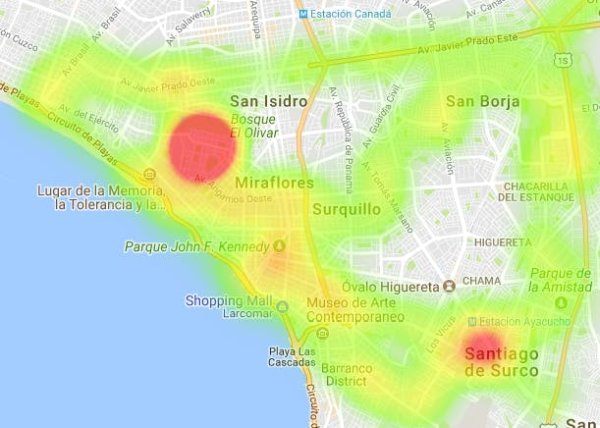
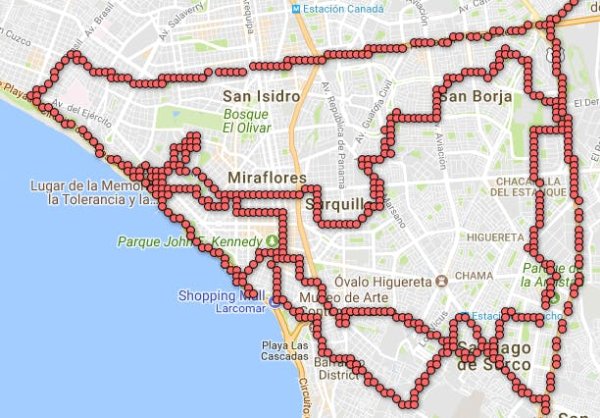
In our case, we want to make a heatmap, so we need to ensure we aggregate our measurements, so we don’t have too many data points close together. Otherwise, if we try to make a heatmap using the raw data, our heatmap will simply show where our Taxi Datalogger spent the most time (since that’s where the most points on the map will be).
One tool that Google provides as part of the Google Cloud Platform is Dataprep (https://cloud.google.com/dataprep/). It’s pretty neat, and gives an intuitive way to sanitize data. However, for what we need right now, our requirements are much simpler.
There’s a very good post here about how much distance each decimal place of a longitude and latitude number represents. It turns out that the 3rd decimal place represents about 110m, which is actually pretty perfect for us.
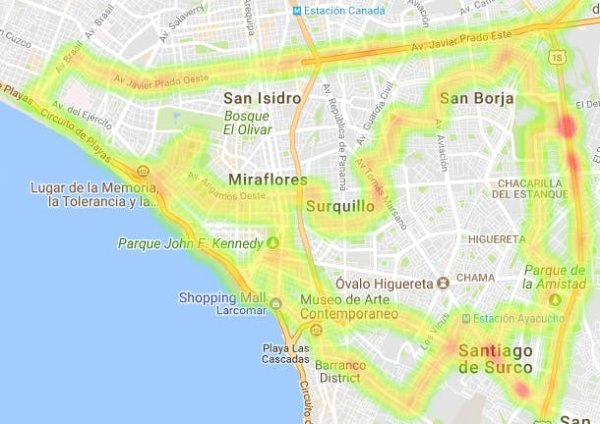
This lets us turn our collection of tracking points that represent where we were, into a grid of regularly spaced points that represent the average values we recorded in each 110m x 110m area across Lima. Note that his is still very hand wavy, and with more data we should really regularize this data better (against time and known reference points), but it’s a start.
We can run the below query against our BigQuery table to create a new table, or export the data as a spreadsheet:
SELECT ROUND(latitude, 3) AS latitude,
       ROUND(longitude, 3) AS longitude,
       AVG(temperature) AS temperature,
       AVG(humidity) as humidity,
       AVG(pressure) as pressure,
       AVG(pm25) as pm25,
       AVG(pm10) as pm10
FROM [taxi-datalogger:taxi_sensor_data.log_entries] GROUP BY latitude, longitude
I saved the results of the query as a new table named aggregated_sensor_values, and exported a spreadsheet to Google Drive to be used in the next part.
Displaying a Heatmap using Google Fusion Tables
Google Fusion Tables is a bit of an older tool, but it works great for quickly looking at our data and generating a heat map.
Just go here: https://fusiontables.google.com and click the ‘Create A Fusion Table’ button.
You should be able to select the spreadsheet you just saved to Google Drive.
After creating your Fusion Table, there should be a Map tab that shows your data as points.
To see a heat map, simply click on the ‘Heatmap‘ option on the left hand side of the map, and choose a ‘Weight’ based on the value you’d like to map (PM2.5 for example). Play with the radius and opacity as desired, and you’re done. Voila! Instant heatmap!
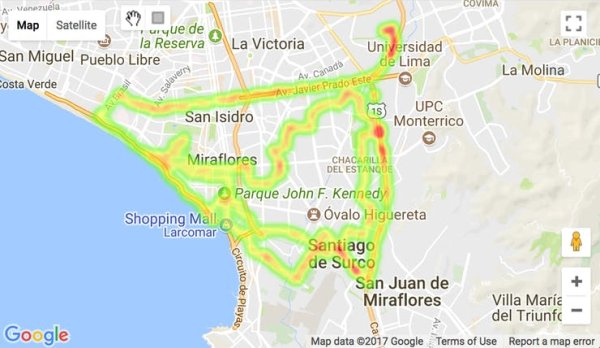
Displaying a Heatmap using the Google Maps Javascript API
The heat map shown in Google Fusion tables is also available as a layer through the Google Maps API, so if you want to build you own custom map or tools with Google Maps, there’s a way. As before, launch a Google cloud shell by clicking the below URL:
https://console.cloud.google.com/home/dashboard?cloudshell=true
Assuming you still have a copy of the git repository (see above in the ‘Getting the Sensor Data into BigQuery’ section), go the the scripts directory:
$ cd Taxi-Datalogger/scripts
Next, edit the heatmap.html file to and change the following placeholder values to reflect your project:
- Your-Maps-API-Key (use the API credentials you created in the Create credentials step)
- Your-OAuth2-Client-ID (use the OAuth2 credentials you created in the Create credentials step)
- Your-Project-ID
- … and depending on where you are, the ceterLatLng variable that specifies where to centre the map.
- You can also change the query that the page uses to populate the map. By default, it uses data from the aggregated_sensor_values table, but you can change that to whatever you like.
$ nano heatmap.html
Next, start the Python SimpleHTTPServer to serve the heatmap page:
$ python -m SimpleHTTPServer 8080
In the Cloud Shell, click on the ‘Web Preview’ button in the upper right hand corner of the page (it looks like a little “eye” in a box), and preview on port 8080.
It should open a new tab. Copy the https://8080-dot-somenumber-dot-devshell.appspot.com portion of the URL (without any of the path after .com).
In another browser window or tab, you’ll need to add this URL to the “Authorized redirect URIs” of your OAuth2 credentials (created in the Create credentials step) on your credentials page: https://console.cloud.google.com/apis/credentials
You should now be able to click on heatmap.html, and after clicking through some OAuth2 dialogs, your map will display. You can now use the rectangle selector tool to select an area on the map to display a heatmap for.
Conclusion
Well, that was fun. Of course, there’s so much more we could do, but it’s a solid start!
With more data, we could do some analysis that is more than just hand waving, and we’d also want to calibrate our sensors so that we knew how accurate they were in comparison to the fixed air monitoring stations run by the Peruvian government (http://www.senamhi.gob.pe).
So many things I’d like to do: More sensor (maybe even virtual sensors using camera/audio and TensorFlow) 12 vdc hookup from the car, functioning taxi light, driver companion app that pairs to the datalogger to provide connectivity (and maybe even use it to pay the driver)… and on and on…
Ultimately the goal will be to scale this up in a city (or cities!!!) and get to the point where we can really discover something new, and maybe even useful.