
Log your Energy Meter data using a Raspberry Pi and plot graphs of your energy consumption.
Background
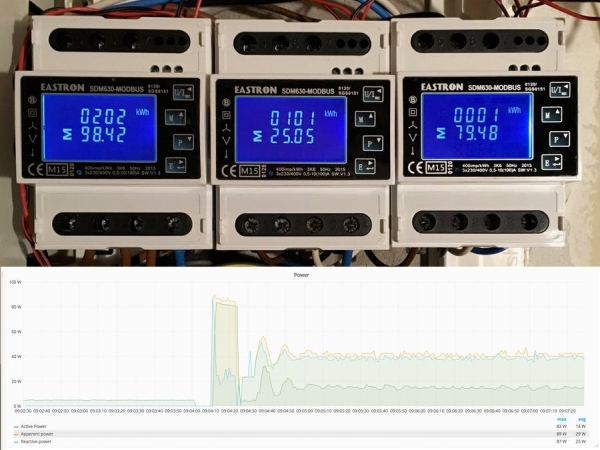
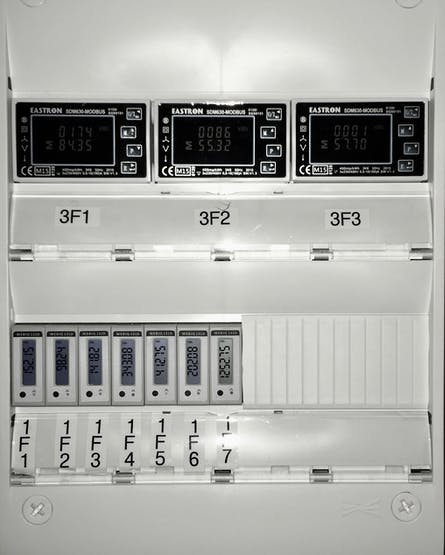
In order to save energy it helps to know your consumption. To do this you can use Energy Meters to track the consumption of all connections in your distribution board. In this project seven 1-phase energy meters and three 3-phase energy meters are used to cover the complete distribution board. The Energy Meters are connected in series with the automatic fuses by an certified electrician.
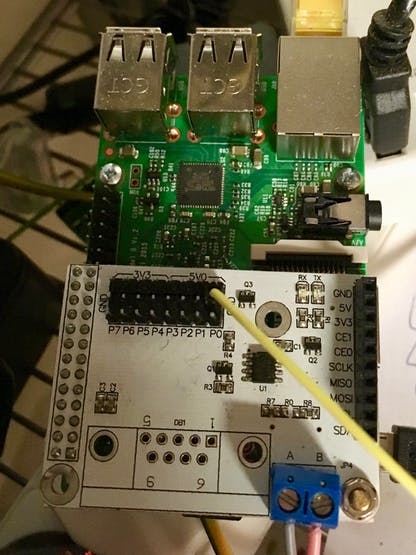
Its been verified to work with a Raspberry Pi 3 with a Linksprite RS485 shield and reading values from a SDM120 and SDM630. By changing the meters.yml file and making a corresponding [model].yml file it should be possible to use other modbus enabled models.
This project uses some Open Source components:
- Minimalmodbus – To read parameters from the energy meters
- InfluxDB – Time series database to store data
- Grafana – Web based data visualization tool
Prerequisite
Download Raspbian Stretch Lite and Flash on SD-card, e.g. by using Etcher. Mount the RS485 shield on the Raspberry Pi’s GPIO header. Power up Rasberry Pi and setup password (passwd) and SSH, localization, network etc. using:
$ sudo raspi-configWith raspi-config open, go to: 5 Interfacing Options -> P6 Serial and Disable serial login shell and Enable serial port hardware (i.e. NO and then YES)
To be able to use the UART you need to disable the built in Bluetooth since it shares the UART. To do so, add the following lines to /boot/config.txt
# Disable built in Bluetooth
dtoverlay=pi3-miniuart-btTo disable the serial console, you also need to edit the /boot/cmdline.txt file to look like the following row:
dwc_otg.lpm_enable=0 console=tty1 root=/dev/mmcblk0p2 rootfstype=ext4 elevator=deadline fsck.repair=yes rootwaitInstall Python Package Manager PIP if not already installed (not installed on Raspbian Lite):
$ sudo apt-get install python-pipInstall Git if not already installed (not installed on Raspbian Lite):
$ sudo apt-get install gitWiring
Connect a twisted pair cable to the Linksprite RS485 shield and make note of which color goes to A and which to B.
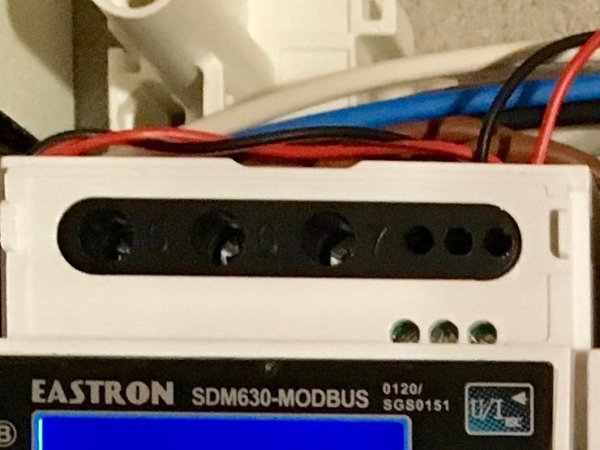
Connect the other end of the cable to the Modbus terminal of the energy meter. Make sure the same color goes to A as the one connected to A on the shield, and the same for B. If more meters are to be connected, continue to connect the meters in series: A to A, B to B. A daisy-chain cable can be handy to use.
Installation instructions
Follow instructions on Github to install InfluxDB, Grafana and Energy Meter Logger source code.
Energy Meter configuration
In this project Modbus enabled energy meters from Eastron are used. The single phase and three phase models shares a lot of registers and the registers of interest are specified in two configuration files: SDM120.yml and SDM630.yml. The parameters of these registers are stored as 32 bits floats (size of 2 registers) and are to be read by function code 04, source:
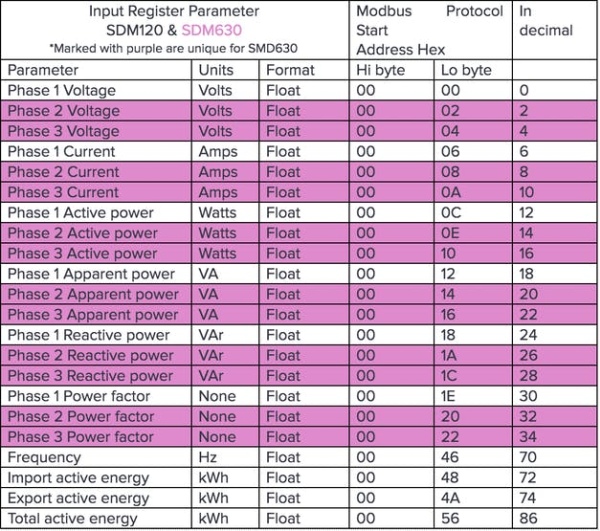
instrument.read_float(address in decimal, function code = 4, 2 registers)From the Eastron documentation we get the following register map to setup our configuration files.
If a different Energy Meter is used, just make your own configuration file and add it to meters.yml where the modbus configuration for each meter also is defined.
meters:
   - name : Meter Group 1
     type : SDM120.yml
     id : 1     # this is the slave address number
     baudrate : 9600   # Baud
     bytesize : 8
     parity : even # none | odd | even
     stopbits : 1
     timeout  : 0.5   # seconds
Grafana
Open Grafana (e.g. http://raspberrypi.local:3000) and login using admin / admin.
Start by creating a Data Source:
- Name: Give a name of your choice
- Type: Select InfluxDB
- URL: http://localhost:8080
- Access: proxy
- Database: db_meters
- Add!
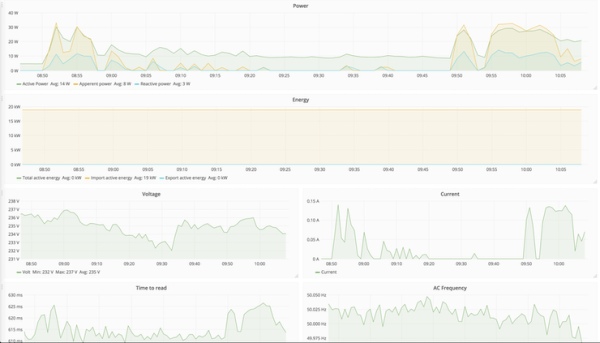
Now add a Dashboard and click Graph. Then click on “Panel Title” and Edit. By clicking on the “select measurement”, “+”, “field value” etc you can select the parameters you are interested in analysing.
One thing worth noting is under “Options” where you should enter the “Min time interval” that should be the same as the time between measurements.
On the “Axes” tab you can the unit for the measurement.
Troubleshooting
Start by investigating the log file. The log level can be set as a parameter when running the script:
read_energy_meter.py --log DEBUG | INFO | WARNING | ERROR
By setting log to DEBUG you get the most information. If you have been writing the log to a file (--logfile ) you can search the log for error using this command:
$ cat energy.log | grep -in 'error' | awk -F: '{print $2" - Line number : "$1}'
Baudrate
Make sure that all your meters connected on the same daisy chain are configured with the same baudrate.
Cable
To ensure good connection it may be a good idea to solder a daisy-chain cable to connect all A terminals in series and all B terminals in series.
Timeouts
A short timeout, about 10 ms, between parameter reads can be made if random CRC errors occurs.
Termination Resistors
It is recommended to use termination resistors at the end of the chain. See this documentation for more info:
https://www.maximintegrated.com/en/app-notes/index.mvp/id/763
Source: Energy Meter Logger