Abstract
There are a wide range of off-the-shelf OBD-II car computers available for purchase, but the
majority of them are either prohibitively expensive or simply unreliable. Furthermore, almost all
of these devices are closed-box systems that cannot be expanded or modified. As such, this
project aims to create a Raspberry Pi-powered OBD-II car computer that will allow data from the
ECU of a 1997 BMW M3 to be displayed on an interactive touchscreen GUI. This will allow the
user to quickly monitor important information about the vehicle during high performance
applications such as track use. The end product should be low-cost, reliable, and expandable.
Additionally, it should be simple to remove the computer and any other associated hardware
from the vehicle so that the vehicle can be returned to its original state if necessary. It should be
able to be adapted to other vehicles with only minor modification, and should allow for the
addition of things such as GPS modules, IMUs, etc. to further improve its capability.
[button link=”https://projects-raspberry.com/turn-raspberry-pi-obd2/” size=”bigger” align=”right” font_ weight=”bold”]Turn your Raspberry pi into obd2[/button]
I. Project Overview
This project covers the design and development of an OBD-II car computer for integration into
my 1997 BMW M3. The vehicle is currently in the process of being converted for track use, so
being able to monitor important vehicle information such as temperatures, pressures, DTCs, etc.
is vital. All collected data should also be logged so that it can be analyzed at a future time (e.g.
analysis of race performance). The finished product utilizes a 3D-printed faceplate that covers
the vehicle’s center console storage area. The touchscreen is integrated into the faceplate, with
the rest of the hardware mounted behind the faceplate.
The hardware consists of a Raspberry Pi 3 that communicates with the vehicle’s ECU via a USB
OBD adapter. This data is then processed on the Pi with a series of Python modules, and is then
output to a 3.5” resistive touchscreen display over SPI. The Pi then logs the data to a CSV file
every second, thus allowing the user to review all of the collected data at a later time. The Pi is
powered by a custom power board that utilizes an Atmel ATtiny85 microcontroller that will
deliver power to the Pi when the ignition is turned on, but then keep the Pi on for 45 seconds
once the ignition is turned off to allow the Pi to safely shutdown.
II. Background
All vehicles sold in the US since January 1, 1996 are equipped with OBD-II (On-board
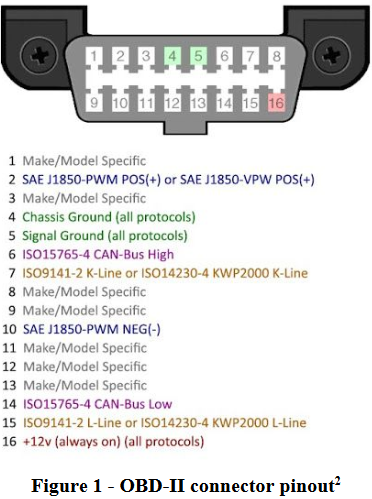
diagnostics II). All automotive manufacturers must use the same standard 16-pin connector
(Figure 1), but they are free to choose from one of five OBD-II signal protocols .
These protocols are SAE J1850 PWM (primarily used by Ford Motor Company), SAE J1850 3
VPW (primarily used by General Motors), ISO 14230-4 , ISO 15765-4 (mandatory for all 4 5
2008+ vehicles sold in the US), and ISO 9141-2 (mostly used by older European vehicles). The 6
development vehicle uses ISO 9141-2 at a speed of 115200 baud.
To communicate with the ECU via any of the aforementioned protocols, we send hexadecimal
codes called parameter IDs (PIDs). These PIDs generally consist of two or more pairs of
1 “OBD2 protocols – OBD Tester.” http://www.obdtester.com/obd2_protocols
2″OBDII pinout – 0xicf ” 4 Mar. 2015, https://0xicf.wordpress.com/tag/obdii-pinout/
3″SAE J1850- Interfacebus.com.” http://www.interfacebus.com/Automotive_SAE_J1850_Bus.html
4″ISO 14230-4:2000 – ISO.org.” https://www.iso.org/standard/28826.html
5″ISO 15765-4:2016 – ISO.org.” https://www.iso.org/standard/67245.html
6″ISO 9141-2:1994 – ISO.org.” https://www.iso.org/standard/16738.html
hexadecimal numbers. The first pair represents the OBD mode (Table 1), and the second is the
exact parameter of that mode.
For example, if we want to get a list of all supported PIDs of mode 1, we would send “0100”.
The ECU would then respond with a list of all supported mode 1 PIDs in hexadecimal. Although
these PIDs are fairly standardized, many automotive OEMs add their own for proprietary sensors
(as allowed by SAE J1979 ). 7
The most common way to interface with an OBD port is to use a dedicated OBD reader, or a
USB OBD adapter that connects to a PC. Almost all USB OBD adapters use some form of an
ELM Electronics ELM327 OBD interpreter microcontroller. I decided to use a Scan Tool 8
OBD Link SX because it had decent reviews and a somewhat affordable price. This adapter 9
actually uses an OBD Solutions STN1110 microcontroller which is fully compatible with the 10
ELM327 command set, but it includes a much faster processor as well as more flash memory and
RAM. It interprets the raw OBD data and converts it so that it can be transmitted over UART.
An FTDI FT230XQ USB to UART bridge IC is then used to transmit the data over the USB 11
cable.
7″J1979_201408 – SAE International.” 11 Aug. 2014, http://standards.sae.org/j1979_201408/
8″OBD – Elm Electronics.” https://www.elmelectronics.com/products/ics/obd/
9″OBDLink® SX USB | OBD Link®.” http://www.obdlink.com/sxusb/
10″STN1110 – Multiprotocol OBD Interpreter IC.” http://www.obdsol.com/solutions/chips/stn1110/
11″FT230X USB Bridge | UART – FTDI Chip.” http://www.ftdichip.com/Products/ICs/FT230X.html
III. Design
Before manufacturing, I sketched out how the end product would fit into the car. The M3 has a
sunglasses storage area in the center console to mount the screen in. I knew that there were
multiple aftermarket products that used this area to mount analog gauges (Figure 2), but I
wanted to design one that would be easily removable, and would be able to house a small
touchscreen display with enough room behind the screen for the Raspberry Pi.
I initially considered purchasing one of these kits and modifying it to fit the touchscreen, but
they were extremely expensive (>$100). I instead opted to develop a faceplate that would cover
the sunglasses storage area, and would be secured to the storage area in an easy-to-remove
fashion.
I then turned my focus to the GUI. I established two main goals for the GUI: readability and ease
of use. Since the display will be outside of the driver’s direct field of view, it should be very easy
to quickly glance at the screen and see all of the data. This meant that the fonts should be large,
simple, and very easy to read. It also meant that things like the tachometer should primarily
convey the info visually (as opposed to just text, since the user probably doesn’t care about the
exact RPM that they’re at). As for the ease of use, I was very concerned about adding something
to the car that would cause the driver to be distracted, so I decided that the GUI should have very
little (if any) user interaction on a day-to-day basis.
12″BMW 3 Gauge Cluster Console with Gauges (E36) – BMP Design.com.”
http://www.bmpdesign.com/product-exec/product_id/884
After establishing the groundwork for the GUI design, I started work on the software side of
things. From the get-go I knew I wanted to make the code extremely modular so that it would be
easy to add new features/modules to the codebase. I also knew that I wanted to build the entire
project using Python, since I had never formally learned it in my courses at Cal Poly. I figured
that this project would be an excellent opportunity to learn the basics of Python. I started
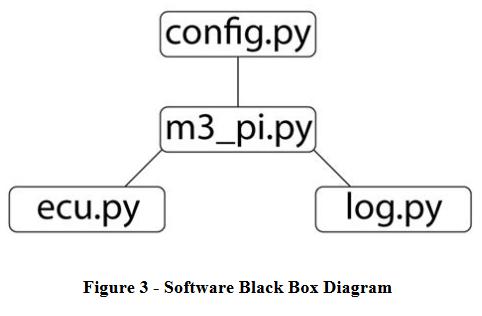
drawing out some black box diagrams of what the code would look like, and eventually settled
on a final design (Figure 3).
I decided that config.py would hold all of the global variables and user preferences that would
be shared between modules. m3_pi.py would be the main controller, and would handle
rendering the GUI, as well as coordinating the ecu.py and log.py modules. ecu.py would
handle the connection to the ECU, and would write all of the data it received to variables
contained in config.py so that all modules could access them. Finally, log.py would handle
the logging of all data to a CSV file. Not pictured in this diagram is shutdown.py, a very
simple script that will be run separate of m3_pi.py and will handle safely shutting down the Pi.
Spending this time in the software design phase ended up being extremely helpful, because
things could have gotten extremely complicated (and messy) if I had tried to implement all of the
code into a single module.
The most difficult component of the project remained: the hardware. I knew I was going to use a
Raspberry Pi 3 because of its low price, power, and Wi-Fi capability, but I wasn’t exactly sure
how I was going to power it. The development vehicle lacked any sort of USB ports that I could
use, so I knew I had to use the constant 12V power from the battery. This meant that I had to
implement some sort of DC-DC converter that would step the 12V from the battery down to 5V
that the Pi could use. However, this posed a pretty significant problem. The 12V from the battery
is always on, regardless of if the car is on or off. This meant that even if the car was off, the Pi
would be pulling a very small amount of power from the car’s battery (~200mA at idle), which
could completely drain the battery if left connected for a week or two. This had me stumped for
awhile until I realized that I could use the accessory (ACC) line to know when the car was
actually on (since it is only live when the key is in the “accessory” and “on” positions).
However, using the ACC line meant that the Pi would instantly lose power as soon as the car
turned off, which could potentially lead to corruption of the SD card on the Pi. I quickly realized
that I could use the ACC line to “switch” the constant 12V on and off to the Pi, I would just need
a small microcontroller that would deliver the constant 12V power to the Pi when the ACC line
was live, and then keep power on to the Pi for 45 seconds once the ACC line goes dead to allow
the Pi to shut down safely.
To tie it all together, I needed a small touchscreen that would mount to the faceplate. My initial
designs used an Adafruit PiTFT 2.8” capacitive touchscreen , which communicates with the Pi 13
using SPI via the GPIO pins. It is also doesn’t need any external power, as it is powered entirely
by the Pi. Unfortunately, I accidentally damaged this screen during early development, so I
moved to the larger Adafruit PiTFT Plus 3.5 resistive touchscreen . Its larger screen size and 14
higher resolution ended up working out well, even despite the downgrade from capacitive to
resistive touch.
IV. Development
With the design of all of the major components of the project finished, I started by getting the
Raspberry Pi 3 up and running with a Linux OS. I decided to go with Raspbian, which is the
official OS of the Raspberry Pi Foundation. Specifically, I opted for Raspbian Lite, a very
minimalist Debian-based OS that has no GUI, just a command line interface. After flashing the
image onto an SD card, I started up the Pi and configured the hostname and password. I then
enabled SSH so I could access the Pi remotely. From there I made sure the Pi was up to date, and
then I used Adafruit’s PiTFT Helper configuration script to install the necessary kernel files so 15
that I could use the touchscreen. Once installed, I plugged in the touchscreen and verified that
everything was working correctly. Then after installing a few Python libraries, the Pi was ready
to go. Specific instructions on how I setup the Raspberry Pi can be found below in section VI:
Detailed Setup Instructions.
I then started work on building the GUI. Unfortunately, Python doesn’t really have any built-in
GUI functionality, but there are several Python GUI framework libraries that can be used to build
your own interactive app. After some research, I decided to use Pygame , a set of Python 1613″Adafruit PiTFT – 320×240 2.8 TFT.” https://www.adafruit.com/product/1601
14″Adafruit PiTFT – 480×320 3.5 TFT.” https://www.adafruit.com/product/2097
15″GitHub – adafruit/Adafruit-PiTFT-Helper” https://github.com/adafruit/Adafruit-PiTFT-Helper
16″Pygame.org.” https://www.pygame.org/
modules mainly meant for creating basic video games. Although it may be video game-focused,
it is fairly easy to use (as opposed to the other Python GUI frameworks, namely PyQt and 17
wx Python ) and there is a large amount of documentation online about it. I was able to get a 18
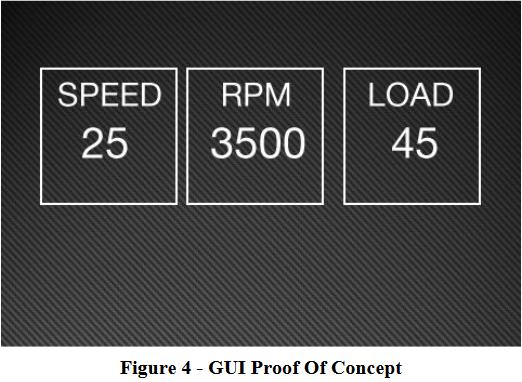
basic “Hello World” GUI up and running fairly quickly, so I started on building a very basic GUI
(Figure 4) as a proof of concept.
I then shifted to getting live data from the vehicle. This ended up being fairly difficult because I
was initially hoping to communicate with the car over a Bluetooth OBD-II adapter (to minimize
amount of cables needed), but I just couldn’t get it paired/trusted and communicating reliably
with the Pi. I decided to switch over to a USB OBD-II adapter, and then used an open source
Python OBD-II library called python-OBD to create a small module that would retrieve the 19
speed, RPM, and engine load from the car. However this proved difficult because it was
necessary to be in the car while it was running to actually get live data to work with. To combat
this, I purchased a Freematics OBD-II Emulator MK220
so that I could develop and test from
anywhere. The device takes a standard 12V input and can be controlled via a simple Windows
GUI over a standard USB cable. This allows the user to simulate all of the various OBD-II PIDs,
as well as serve up to 6 DTCs (Diagnostic trouble codes). After some initial setup, the emulator
was configured so that it used the exact same ISO 9141-2 protocol as the target vehicle.
17″Riverbank | Software | PyQt | What is PyQt?.” https://riverbankcomputing.com/software/pyqt/
18″wxPython.” https://wxpython.org/
19″python-OBD.” http://python-obd.readthedocs.io/
20″Freematics OBD-II Emulator MK2.” http://freematics.com/store/?route=product/product&product_id=71
With the emulator working, I was able to get data from the ECU to display on the basic GUI.
However, I noticed that the GUI was extremely slow to update. After a fair amount of
debugging, I realized that the issue was that the ECU queries that I was making were
synchronous, and thus were blocking the UI. This meant that every time a query was made, the
program would block waiting for data and not update the GUI until the query finished. Luckily, I
was able to switch over to python-OBD’s asynchronous connection functionality which allowed
the UI to be updated on-the-fly. This asynchronous mode uses a threaded update loop that will
fire callbacks for the different queries as soon as new data is available from the ECU.
Now that I had the asynchronous communication established, I queried the M3’s ECU for a list
of supported PIDs using the command “0100”. Based on the response, I picked the ones that I
thought would be most useful to an end user (speed, RPM, MAF, engine load, throttle position,
coolant temperature, and intake temperature). However, there was one data point that I was
really hoping for that I was unable to get through OBD. I really wanted to have the current gear
that the car was in, since it would be a really useful data point to have for track use. To remedy
this, I decided to build a lookup table that would tell me what gear the car was theoretically in,
given some RPM and speed. To do this, I used the below formula (Figure 5) to populate the
table with the theoretical speeds the vehicle would be at a given RPM and gear.
(Axle Ratio x Vehicle Speed x Transmission Ratio x 336.13) / Tire Diameter
Figure 5 – Formula for calculating theoretical engine RPM
In the case of the M3, the axle ratio is the gear ratio of the LSD (limited slip differential) that is
located on the rear axle. The transmission ratio is the gear ratio of the current gear the vehicle is
in. The M3 features a 5-speed transmission, with the final gear using a straight 1:1 ratio. The
336.13 is used to convert the numerator to RPM (63360 inches per mile / 60 minutes per hour x
Pi.). Finally, the tire diameter is simply the diameter of the wheels, which for the M3 is 17”. This
approach ended up being surprisingly accurate, especially once combined with some logic to
detect when the car is theoretically in neutral (e.g The car is stopped at 0 MPH but the engine is
still idling at around 800 RPM).
I then moved on to finalizing the GUI design. I drew some inspiration from my internship with
Porsche at the beginning of this academic year, where I got to test a wide range of different next
generation infotainment systems. I was really inspired by Audi’s “Virtual Cockpit”, 12.3” high
resolution display that completely replaces the traditional instrument cluster. After a few
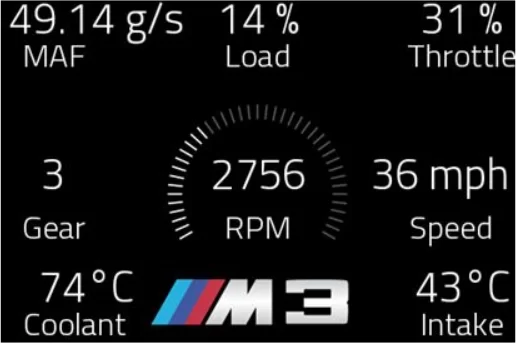
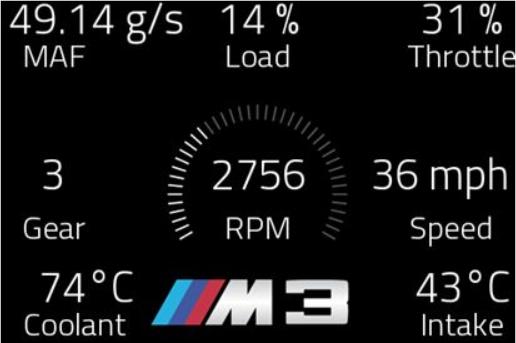
revisions, I settled on a final design (Figure 6) that displays all of the desired ECU data in a
beautiful yet readable font, has a tachometer that combines both text and visual elements, and
has a M3 logo. Tapping the screen loads a separate view that displays any DTCs stored on the
ECU (Figure 7).
The tachometer consists of 42 different images that were designed in Adobe Illustrator. Each line
on the tachometer represents 200 RPM, so each image builds on the next by highlighting another
line. This functions as the “needle” for the tachometer, but with a much simpler design. I also
made the entire tachometer turn red as the RPM approaches redline (around 7000 RPM). The
design makes it really easy to quickly glance at the screen and see what approximate RPM
you’re at, without actually needing to read the exact RPM number.
Once the GUI was completed, I moved on to the final software component: logging. This ended
up being fairly simple since Python has a built-in CSV module. Once an ECU connection is established, the logger create a new CSV with the current time as the name (to make it easy to go
back through logs in the future). The logger accepts an array of all of the data to be logged, and it
will then append a new row to the CSV that contains all of that data. Since OBD-II doesn’t
update extremely quickly, I limited the logging to once a second. For debugging/demonstration
purposes, I wrote a function that would read from a log file and use that data to feed the GUI (as
opposed to the live ECU data). This was extremely useful for times when I was working on the
GUI but wasn’t in the car or had the OBD emulator handy.
With the software completed, I moved on to the power supply. Based on my initial design
research I knew that I would need some sort of microcontroller that would provide power to the
Pi when the ACC line was live, and then keep the Pi on for 45 seconds once the ACC line went
dead. I ended up using an Atmel ATtiny85 8-bit AVR microcontroller. I really enjoyed the
exposure I had to MCUs in CPE 329, so I was extremely excited to get to work with one again.
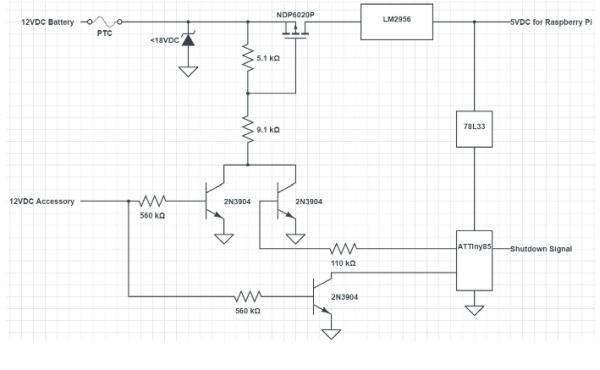
Circuits have never been my strong suit, so I enrolled the help of my father who is an electrical
engineer to help me design a circuit (Figure 8) around the ATtiny85 that would provide the
functionality that I wanted.
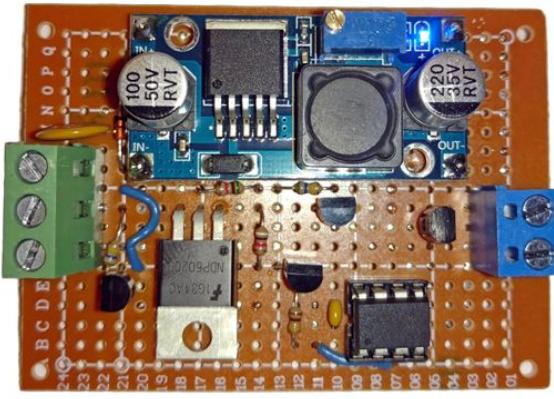
We then built the circuit on a small proto board (Figure 9) that could be mounted next to the
Raspberry Pi. The board has three inputs: Ground, ACC, and 12V. Using these inputs, the board
will provide power to the Pi as soon as the ACC line is live, and will then keep power on to the
Pi for 45 seconds once the ACC line goes low. The board uses a Texas Instruments LM2596 DC-DC converter to step the 12V battery power down to a stable 5V input for the Pi. AST Microelectronics 78L33 linear voltage regulator is then used to step that 5V down to 3.3V for the ATtiny85. When the ACC line goes low, the power supply board sends a high signal over an output line that is connected to a GPIO pin on the Raspberry Pi. When the Pi sees this pin is high, it it will execute a full shutdown with sudo shutdown -h now. This process only takes 10 seconds or so, which means the Pi will be fully shut down before power is cut to it.
I then needed to actually mount everything in the car. The OBD port is located in the driver side
footwell, so I used a right angle OBD connector to connect the port to the USB OBD cable (so
that it wouldn’t stick out into the footwell), and then ran the USB cable behind the footwell panel
to the Pi in the center console. This ended up being a really clean solution because you can’t
even tell anything is plugged into the OBD port when sitting in the car. I then spliced into the
12V, ACC, and ground lines going into the stereo, and ran new wire from the splices to the
power board. Since I wanted the power board and Raspberry Pi hidden behind the faceplate, I
used standoff screws to securely mount them inside of the storage cubby. I then used a 40 pin
ribbon cable to connect the touchscreen to the GPIO pins on the Raspberry Pi. The screen
doesn’t actually use all 40 GPIO pins (only the 5 SPI pins as well as GPIO 24 and 25), so it
provides 26 GPIO pins on the back of the screen PCB. Finally, I ran two jumper wires from the
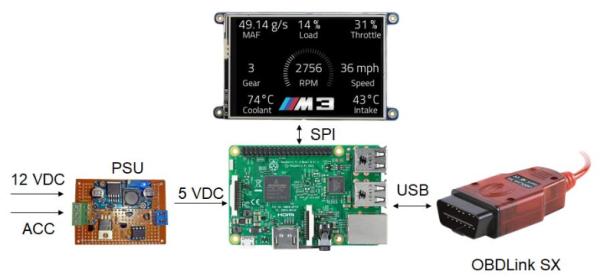
power board signal pin and signal ground to two GPIO pins on the screen. A final hardware
diagram can be found below (Figure 10).
The last hardware development step was the faceplate. I had a few sheets of black ABS plastic
laying around from a previous project, so I took a few measurements and roughly cut a faceplate
that would cover the storage area and have a cutout in the middle of the faceplate for the
touchscreen. The ABS made it really easy to rapidly prototype faceplate designs, so once I had a
design I was happy with I moved on to making it out of something thicker. I work part-time at a
local company called iFixit, and they have a large laser cutter/engraver that is great for cutting
wood, plastic, and very thin metal. I used Adobe Illustrator to make a design based off of my
ABS testing, and then used the design to cut out a wood faceplate. These initial designs were
based around the smaller 2.8” capacitive touchscreen, but unfortunately the screen was
accidentally damaged while I was test fitting one of the faceplates in the vehicle. This accident
ended up being helpful, because I found a larger 3.5” resistive touchscreen that would just barely
fit on the faceplate. This gave me a lot more screen real estate for the GUI, and ended up being
slightly easier to mount to the faceplate. I redesigned the faceplate to include the new 3.5”
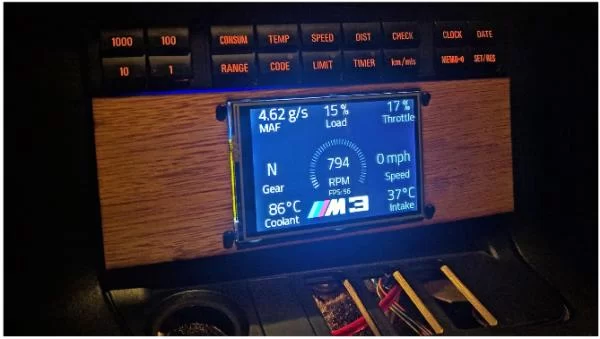
screen, and also added mounting holes to mount the screen to the faceplate (Figure 11).
The wood faceplate looked great, but I realized that if I wanted to build the faceplate out of
plastic, I’d need to 3D-print it. Luckily, one of my coworkers actually has a 3D printer that he
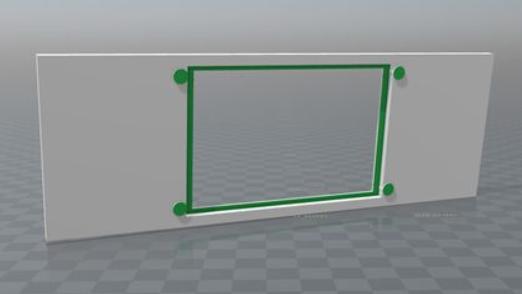
was willing to let me use, so I quickly built a 3D model (Figure 12) of the faceplate that had two
important changes (as shown in green on the model) from the final wood faceplate. The first was
that the screen would actually screw into the faceplate, without the need for a nut to secure it on
the other side. This meant that there wouldn’t be any exposed screw heads (as seen above),
which made the faceplate look a lot sleeker. Secondly, I added a lip that would extend over the
bezel of the touchscreen so that it would appear that the screen was almost built into the
faceplate.
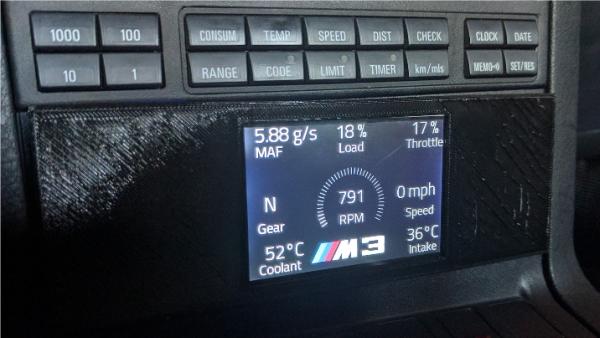
I wasn’t exactly sure how to mount the faceplate to the storage area, but I knew I wanted it to be
easily detachable. I ended up using two metal L brackets mounted inside the left and right sides
of the cubby. I then attached two neodymium magnets to the back of the faceplate so that they
would line up with the brackets and “snap” into place. This ended up working extremely well,
and I was very pleased with how it came out (Figure 13). Note that the pictured faceplate is not
the final version, as it is actually a rough print for demonstration purposes. I plan to do a final
high-quality print in the near future.
The last thing to do was to get the GUI to start up whenever the Pi turns on. To do this, I
modified the /etc/rc.local file. This file is a simple script that will execute any commands
located within it as soon as the system has finished booting. I added two lines to the file, one for
the shutdown script, and one for the main control module: sudo python
home/pi/shutdown.py & and sudo python home/pi/m3_pi.py &. It’s very important
to include the ampersand at the end of each line, as these let the OS know that it should fork each
of the commands and run them in a separate process. This allows them to each run in the
background. With these two lines added, the GUI launches and has live data within ~25 seconds
of the vehicle being started.
V. Conclusion/Future Additions
Primary development of this project stopped at around week 7 of this quarter, and I’ve had the Pi
installed in the car since then. Since I drive the vehicle almost every day, the Pi has received a
great deal of testing, and I’ve yet to find any major issues.
With that being said, I plan to continue work on this project well after I’ve graduated, and I’ve
already started work on some new features. I currently have a GlobalSat BU-353-S4 USB GPS 21
module that I have working with the Raspberry Pi, but I’ve been running into some threading
issues getting it integrated into my existing code. Once I sort these issues out, it will be relatively
trivial to install the module in the car. I plan to add another screen to the GUI that will display all
of the GPS data (latitude, longitude, altitude, speed, etc.), and have all of this data logged
alongside the rest of the ECU data. Additionally, since the GPS provides the current time
wherever you are, I plan to use it to set the clock on the Raspberry Pi. The Pi lacks a real-time
clock (RTC), so the timestamps on the logs can be slightly off if the Pi wasn’t able to sync with a
Network Time Protocol (NTP) server over Wi-Fi. I’m also planning to add a 9-axis inertial
measurement unit (IMU). The IMU combines a 3-axis gyroscope, 3-axis accelerometer, and a
3-axis magnetometer. I plan to use this IMU to track things like lateral g-force, which is really
useful to have for track applications. I will also add a screen to the GUI that will show live
g-force data. All of the IMU data would then be logged alongside the rest of the current data.
My end goal is to have the Pi automatically upload the log files to my home web server over
Wi-Fi whenever I come home. I’ll then create a web app that will allow me to visualize all of this
data. For example, I envision combining the GPS data with the ECU data to generate heat maps
that will show the vehicle’s speed and current gear at every point on the trip.
As for the hardware, I’d like to transition from the Raspberry Pi 3 to a Raspberry Pi Zero W. I
have no need for the extra processing power that the Pi 3 provides, so the Zero W would be a
great choice due to its extremely small form factor and even lower cost. I’d also like to explore
the possibility of directly connecting to the vehicle’s CAN (controller area network) bus instead
of OBD-II. The response time of OBD-II is somewhat lacking, and it can take up to a second to
get new data. This is acceptable for data that doesn’t change often like temperatures, but terrible
for things like RPM, throttle position, and speed. Connecting directly over CAN would hopefully
eliminate the response time issues, and would open up the door to actually controlling things in
the car that communicate over CAN bus (lock the doors, switch on lights, etc.).
21″GlobalSat BU-353-S4 is – USGlobalsat Corporate.” http://usglobalsat.com/p-688-bu-353-s4.aspx
Finally, I plan to open-source my code and upload it to GitHub. I’ll have to genericize the code it
a bit since it has some M3-specific code (such as gear LUT, tachometer, etc.), but this shouldn’t
be an issue. I spent countless hours on this project, so I’d love to be able to share it with the
world so that anyone can add an OBD computer to their vehicle.
VI. Detailed Setup Instructions
Since I hope to open source all of code, I made sure to document every step of the configuration
process that I went through to transform a stock Raspbian Lite image on a Raspberry Pi 3 to the
finished product that is currently in the vehicle. Please note that these steps assume you have a
basic working knowledge of how to use a Linux operating system. Additionally, it’s important
that you never run sudo apt-get update and sudo apt-get upgrade, as these will break
the Adafruit kernel that enables the touchscreen.
1. Flash the latest Raspbian Jessie Lite image onto an SD card (at least 8 GB required). To
flash the image, I recommend using Etcher , an open source SD card imager. 22
2. Connect the Raspberry Pi to a monitor, keyboard, and power. If the flash was successful,
you should see a ton of debug lines scroll by on the monitor as the Pi boots up.
3. Once the Pi has booted, open a terminal window and set up the Wi-Fi by adding your
network details to /etc/wpa_supplicant/wpa_supplicant.conf
4. This step is optional, but it is recommended. Run sudo raspi-config, and change
your hostname, password, and enable SSH (so that you can access the Pi remotely).
5. You’ll then want to make sure that the Pi is completely up to date. From a terminal, run
sudo apt-get update and sudo apt-get upgrade.
6. We’ll now install a custom kernel to enable support for the touchscreen. Adafruit
provides a fantastic script to automate this process. The exact instructions are too verbose
for this paper, so I highly recommend checking out their documentation.
7. If everything installed correctly, you should be able to plug in the touchscreen and see the
command line interface.
8. We’re now going to install all of the dependencies. From a terminal, run sudo apt-get
install python-pip python2.7-dev python-pygame. This installs the Python
package manager, Python dev tools, and the Pygame UI framework.
9. We’ll now use the Python package manager to install two more libraries. From a
terminal, run sudo pip install obd and sudo pip install numpy
10. We’ll now transfer the M3 Pi files over to the Pi. You’ll want to place them in the home
directory of the Pi, e.g. /home/pi. All of the code can be found below. It should be
22″Etcher.” https://etcher.io/
obvious, but due to the limitations of paper I am unable to include items such as the
tachometer images, fonts, etc in this report. These will be found on my GitHub repository
at a later date.
11. We’re now going to make our code launch on startup. From a terminal run sudo nano
/etc/rc.local, and add the following two lines before the exit 0 line: python
/home/pi/shutdown.py & and python /home/pi/m3_pi.py &
VII. Appendices
config.py
#!/usr/bin/python
import ecu
import datetime
import numpy as np
# Globals.
logLength = 0
dtc_iter = 0
time_elapsed_since_last_action = 0
gui_test_time = 0
logIter = 1
ecuReady = False
debugFlag = False
settingsFlag = False
piTFT = True
startTime = datetime.datetime.today().strftime('%Y%m%d%H%M%S')
RESOLUTION = (480, 320)
BLACK = (0, 0, 0)
WHITE = (255, 255, 255)
# LUT representing the speeds at each of the five gears. Each entry is +200 RPM, and
is directly linked to rpmList.
speedArr = np.array([[4, 7, 10, 14, 17], [5, 9, 14, 18, 23], [7, 11, 17, 23, 28], [8,
14, 21, 28, 34], [9, 16, 24, 32, 40], [11, 18, 27, 37, 46], [12, 21, 31, 41, 51],
[14, 23, 34, 46, 57], [15, 25, 38, 50, 63], [16, 27, 41, 55, 68], [18, 30, 45, 60,
74], [19, 32, 48, 64, 80], [20, 34, 51, 69, 85], [22, 37, 55, 73, 91], [23, 39, 58,78, 97],
[24, 41, 62, 83, 102], [26, 43, 65, 87, 108], [27, 46, 69, 92, 114], [28,
48, 72, 96, 120], [30, 50, 75, 101, 125], [31, 53, 79, 106, 131], [33, 55, 82, 110,
137], [34, 57, 86, 115, 142], [35, 59, 89, 119, 148], [37, 62, 93, 124, 154], [38,
64, 96, 129, 159]])
# List of RPM values for above LUT.
rpmList = np.array([750, 1000, 1250, 1500, 1750, 2000, 2250, 2500, 2750, 3000, 3250,
3500, 3750, 4000, 4250, 4500, 4750, 5000, 5250, 5500, 5750, 6000, 6250, 6500, 6750,
7000])
m3_pi.py
#!/usr/bin/python
import config, ecu, log, time, datetime, sys
import pygame, time, os, csv
from pygame.locals import *
# Helper function to draw the given string at coordinate x,y, relative to center.
def drawText(string, x, y, font):
if font == “readout” :
text = readoutFont.render(string, True, config.WHITE)
elif font == “label”:
text = labelFont.render(string, True, config.WHITE)
elif font == “fps”:
text = fpsFont.render(string, True, config.WHITE)
textRect = text.get_rect()
textRect.centerx = windowSurface.get_rect().centerx + x
textRect.centery = windowSurface.get_rect().centery + y
windowSurface.blit(text, textRect)
# Connect to the ECU and GPS.
if not config.debugFlag:
ecu.ecuThread()
# Give time for the ECU to connect before we start the GUI.
while not config.ecuReady:
time.sleep(.01)
# Load all of our tach images into an array so we can easily access them.
background_dir = ‘tach/'
background_files = [‘%i.png' % i for i in range(0, 42)]
ground = [pygame.image.load(os.path.join(“/home/pi/tach/”, file)) for file in
background_files]
# Load the M3 PI image.
img = pygame.image.load(“/home/pi/images/m3_logo.png”)
img_button = img.get_rect(topleft=(135, 220))
# Set up the window. If piTFT flag is set, set up the window for the screen. Else
create it normally for use on normal monitor.
if config.piTFT:
os.putenv(‘SDL_FBDEV', ‘/dev/fb1')
pygame.init()
pygame.mouse.set_visible(0)
windowSurface = pygame.display.set_mode(config.RESOLUTION)
else:
windowSurface = pygame.display.set_mode(config.RESOLUTION, 0, 32)
# Set up fonts
readoutFont = pygame.font.Font(“/home/pi/font/ASL_light.ttf”,40)
labelFont = pygame.font.Font(“/home/pi/font/ASL_light.ttf”,30)
fpsFont = pygame.font.Font(“/home/pi/font/ASL_light.ttf”,20)
# Set the caption.
pygame.display.set_caption(‘M3 PI')
# Create a clock object to use so we can log every second.
clock = pygame.time.Clock()
# Create the csv log file with the specified header.
log.createLog([“TIME”, “RPM”, “SPEED”, “COOLANT_TEMP”, “INTAKE_TEMP”, “MAF”,
“THROTTLE_POS”, “ENGINE_LOAD”])
# Debug: Instead of reading from the ECU, read from a log file.
if config.debugFlag:
# Read the log file into memory.
list = log.readLog(‘/logs/debug_log.csv')
# Get the length of the log.
logLength = len(list)
# Run the game loop
while True:
for event in pygame.event.get():
if event.type == QUIT:
# Rename our CSV to include end time.
log.closeLog()
# Close the connection to the ECU.
ecu.connection.close()
pygame.quit()
sys.exit()
if event.type == MOUSEBUTTONDOWN:
# Toggle the settings flag when the screen is touched.
config.settingsFlag = not config.settingsFlag
if not config.debugFlag:
# Figure out what tach image should be.
ecu.getTach()
# Figure out what gear we're *theoretically* in.
ecu.calcGear(int(float(ecu.rpm)), int(ecu.speed))
# Clear the screen
windowSurface.fill(config.BLACK)
# Load the M3 logo
windowSurface.blit(img, (windowSurface.get_rect().centerx – 105,
windowSurface.get_rect().centery + 60))
# If the settings button has been pressed:
if (config.settingsFlag):
drawText(“Settings”, -160,-145, “readout”)
# Print all the DTCs
if ecu.dtc:
for code,desc in ecu.dtc:
drawText(code, 0, -80 + (dtc_iter * 50), “label”)
dtc_iter += 1
if dtc_iter == len(dtc):
dtc_iter = 0
else:
drawText(“No DTCs found”, 0, -80, “label”)
else:
# Calculate coordinates so tachometer is in middle of screen.
coords = (windowSurface.get_rect().centerx – 200,
windowSurface.get_rect().centery – 200)
# Load the tach image
windowSurface.blit(ground[ecu.tach_iter], coords)
# Draw the RPM readout and label.
drawText(str(ecu.rpm), 0, 0, “readout”)
drawText(“RPM”, 0, 50, “label”)
# Draw the intake temp readout and label.
drawText(str(ecu.intakeTemp) + “\xb0C”, 190, 105, “readout”)
drawText(“Intake”, 190, 140, “label”)
# Draw the coolant temp readout and label.
drawText(str(ecu.coolantTemp) + “\xb0C”, -160, 105, “readout”)
drawText(“Coolant”, -170, 140, “label”)
# Draw the gear readout and label.
drawText(str(ecu.gear), -190, 0, “readout”)
drawText(“Gear”, -190, 50, “label”)
# Draw the speed readout and label.
drawText(str(ecu.speed) + ” mph”, 170, 0, “readout”)
drawText(“Speed”, 180, 50, “label”)
# Draw the throttle position readout and label.
drawText(str(ecu.throttlePosition) + ” %”, 190, -145, “readout”)
drawText(“Throttle”, 190, -110, “label”)
# Draw the MAF readout and label.
drawText(str(ecu.MAF) + ” g/s”, -150, -145, “readout”)
drawText(“MAF”, -190, -110, “label”)
# Draw the engine load readout and label.
drawText(str(ecu.engineLoad) + ” %”, 0, -145, “readout”)
drawText(“Load”, 0, -110, “label”)
# If debug flag is set, feed fake data so we can test the GUI.
if config.debugFlag:
# Debug gui display refresh 10 times a second.
if config.gui_test_time > 500:
log.getLogValues(list)
ecu.calcGear(ecu.rpm, ecu.speed)
ecu.getTach()
config.gui_test_time = 0
# Update the clock.
dt = clock.tick()
config.time_elapsed_since_last_action += dt
config.gui_test_time += dt
# We only want to log once a second.
if config.time_elapsed_since_last_action > 1000:
# Log all of our data.
data = [datetime.datetime.today().strftime(‘%Y%m%d%H%M%S'), ecu.rpm,
ecu.speed, ecu.coolantTemp, ecu.intakeTemp, ecu.MAF, ecu.throttlePosition,
ecu.engineLoad]
log.updateLog(data)
# Reset time.
config.time_elapsed_since_last_action = 0
# draw the window onto the screen
pygame.display.update()
ecu.py
#!/usr/bin/python
import config
from threading import Thread
import obd
import numpy as np
# Globals
rpm = 0
speed = 0
coolantTemp = 0
intakeTemp = 0
MAF = 0
throttlePosition = 0
timingAdvance = 0
engineLoad = 0
tach_iter = 0
gear = 0
connection = None
dtc = None
# Function to figure out what tach image we should display based on the RPM.
def getTach():
global tach_iter
if rpm == 0:
tach_iter = 0
elif (rpm >= 0) & (rpm < 200):
tach_iter = 1
elif (rpm >= 200) & (rpm < 400):
tach_iter = 2
elif (rpm >= 400) & (rpm < 600):
tach_iter = 3
elif (rpm >= 600) & (rpm < 800):
tach_iter = 4
elif (rpm >= 800) & (rpm < 1000):
tach_iter = 5
elif (rpm >= 1000) & (rpm < 1200):
tach_iter = 6
elif (rpm >= 1200) & (rpm < 1400):
tach_iter = 7
elif (rpm >= 1400) & (rpm < 1600):
tach_iter = 8
elif (rpm >= 1600) & (rpm < 1800):
tach_iter = 9
elif (rpm >= 1800) & (rpm < 2000):
tach_iter = 10
elif (rpm >= 2000) & (rpm < 2200):
tach_iter = 11
elif (rpm >= 2200) & (rpm < 2400):
tach_iter = 12
elif (rpm >= 2400) & (rpm < 2600):
tach_iter=13elif (rpm>=2600)&(rpm<2800):tach_iter=14elif (rpm>=2800)&(rpm<3000):tach_iter=15elif (rpm>=3000)&(rpm<3200):tach_iter=16elif (rpm>=3200)&(rpm<3400):tach_iter=17elif (rpm>=3400)&(rpm<3600):tach_iter=18elif (rpm>=3600)&(rpm<3800):tach_iter=19elif (rpm>=3800)&(rpm<4000):tach_iter=20elif (rpm>=4000)&(rpm<4200):tach_iter=21elif (rpm>=4200)&(rpm<4400):tach_iter=22elif (rpm>=4400)&(rpm<4600):tach_iter=23elif (rpm>=4600)&(rpm<4800):tach_iter=24elif (rpm>=4800)&(rpm<5000):tach_iter=25elif (rpm>=5000)&(rpm<5200):tach_iter=26elif (rpm>=5200)&(rpm<5400):tach_iter=27elif (rpm>=5400)&(rpm<5600):tach_iter=28elif (rpm>=5600)&(rpm<5800):tach_iter=29elif (rpm>=5800)&(rpm<6000):tach_iter=30elif (rpm>=6000)&(rpm<6200):tach_iter=31elif (rpm>=6200)&(rpm<6400):tach_iter=32elif (rpm>=6400)&(rpm<6600):tach_iter=33elif (rpm>=6600)&(rpm<6800):tach_iter=34elif (rpm>=6800)&(rpm<7000):tach_iter=35elif (rpm>=7000)&(rpm<7200):tach_iter=36elif (rpm>=7200)&(rpm<7400):
tach_iter = 37elif (rpm >= 7400) & (rpm < 7600):
tach_iter = 38
elif (rpm >= 7600) & (rpm < 7800):
tach_iter = 39
elif (rpm >= 7800) & (rpm < 8000):
tach_iter = 40
elif (rpm >= 8000):
tach_iter = 41
# Given an array and a value, find what array value our value is closest to and
return the index of it.
def find_nearest(array, value):
idx = (np.abs(array-value)).argmin()
return idx
# Given RPM and speed, calculate what gear we're probably in.
def calcGear(rpm, speed):
global gear
# We're stopped, so we're obviously in neutral.
if speed == 0:
gear = ‘N'
# We're moving but the RPM is really low, so we must be in neutral.
# M3 seems to idle at around 800 rpm
elif (rpm < 875) & (speed > 0):
gear = ‘N'
# We must be in gear.
else:
# Find the index of the closest RPM to our current RPM.
closestRPMIndx = find_nearest(config.rpmList, rpm)
# Find the index of the closest speed to our speed.
closestSpeedIndx = find_nearest(config.speedArr[closestRPMIndx], speed)
gear = str (closestSpeedIndx + 1)
class ecuThread(Thread):
def __init__(self):
Thread.__init__(self)
self.daemon = True
self.start()
def run(self):
global connection
ports = obd.scan_serial()
print ports
# DEBUG: Set debug logging so we can see everything that is happening.
obd.logger.setLevel(obd.logging.DEBUG)
# Connect to the ECU.
connection = obd.Async(“/dev/ttyUSB0″, 115200, “3”, fast=False)
# Watch everything we care about.
connection.watch(obd.commands.RPM, callback=self.new_rpm)
connection.watch(obd.commands.SPEED, callback=self.new_speed)
connection.watch(obd.commands.COOLANT_TEMP,
callback=self.new_coolant_temp)
connection.watch(obd.commands.INTAKE_TEMP,
callback=self.new_intake_temp)
connection.watch(obd.commands.MAF, callback=self.new_MAF)
connection.watch(obd.commands.THROTTLE_POS,
callback=self.new_throttle_position)
connection.watch(obd.commands.ENGINE_LOAD,
callback=self.new_engine_load)
connection.watch(obd.commands.GET_DTC, callback=self.new_dtc)
# Start the connection.
connection.start()
# Set the ready flag so we can boot the GUI.
config.ecuReady = True
def new_rpm(self, r):
global rpm
rpm = int(r.value.magnitude)
def new_speed(self, r):
global speed
speed = r.value.to(“mph”)
speed = int(round(speed.magnitude))
def new_coolant_temp(self, r):
global coolantTemp
coolantTemp = r.value.magnitude
def new_intake_temp(self, r):
global intakeTemp
intakeTemp = r.value.magnitude
def new_MAF(self, r):
global MAF
MAF = r.value.magnitude
def new_throttle_position(self, r):
global throttlePosition
throttlePosition = int(round(r.value.magnitude))
def new_timing_advance(self, r):
global timingAdvance
timingAdvance = int(round(r.value.magnitude))
def new_engine_load(self, r):
global engineLoad
engineLoad = int(round(r.value.magnitude))
def new_dtc(self, r):
global dtc
dtc = r.value
log.py
#!/usr/bin/python
import csv, os
from config import *
# Function to create a csv with the specified header.
def createLog(header):
# Write the header of the csv file.
with open(‘/home/pi/logs/' + startTime + ‘.csv', ‘wb') as f:
w = csv.writer(f)
w.writerow(header)
# Function to append to the current log file.
def updateLog(data):
with open(‘/home/pi/logs/' + startTime + ‘.csv', ‘a') as f:
w = csv.writer(f)
w.writerow(data)
# Function to close the log and rename it to include end time.
def closeLog():
endTime = datetime.datetime.today().strftime(‘%Y%m%d%H%M%S')
os.rename(‘home/pi/logs/' + startTime + ‘.csv', ‘logs/' + startTime + “_” +
endTime + ‘.csv')
# Debug function to read from log file for GUI testing.
def readLog(logFile):
with open(logFile, ‘rb') as f:
reader = csv.reader(f)
logList = list(reader)
return logList
# Debug function that reads from log file and assigns to global values.
def getLogValues(logFile):
global logIter
global rpm
global speed
global coolantTemp
global intakeTemp
global MAF
global throttlePosition
global engineLoad
rpm = int(logFile[logIter][1])
speed = int(logFile[logIter][2])
coolantTemp = logFile[logIter][3]
intakeTemp = logFile[logIter][4]
MAF = logFile[logIter][5]
# Cludgy fix for issue where MAF was logged as really log float, causing
clipping when displayed on GUI.
MAF = format(float(MAF), ‘.2f')
throttlePosition = logFile[logIter][6]
engineLoad = logFile[logIter][7]
logIter += 1
# Reset iterator.
if logIter == logLength
shutdown.py
#!/usr/bin/python
import RPi.GPIO as GPIO
import os, time
# Set GPIO pin 17 as input for shutdown signal.
GPIO.setmode(GPIO.BCM)
GPIO.setup(17, GPIO.IN)
# Print message to console.
print("Running shutdown script...")
while True:
if (GPIO.input(17)):
os.system("sudo shutdown -h now")
break
Bill of Materials
Component Price
Raspberry Pi 3 $35
ScanTool OBDLink SX $30
Adafruit PiTFT 3.5 $45
3D-Printed Faceplate $10
Power Supply Components $8
Various wires and cables $2
Total: $130
Development Vehicle Supported PIDs
This is a list of the 53 OBD parameters that the M3 supports. Note that this list is very short
compared to what a modern car supports, most likely because OBD-II had only been around for
less than a year before the M3 was manufactured.
0112: Secondary Air Status
0113: O2 Sensors Present
0110: Air Flow Rate (MAF)
0111: Throttle Position
0114: O2: Bank 1 – Sensor 1 Voltage
0115: O2: Bank 1 – Sensor 2 Voltage
0118: O2: Bank 2 – Sensor 1 Voltage
0119: O2: Bank 2 – Sensor 2 Voltage
021C: DTC OBD Standards Compliance
ATI: ELM327 version string
0140: Supported PIDs [41-60]
020C: DTC Engine RPM
03: Get DTCs
07: Get DTCs from the current/last driving cycle
04: Clear DTCs and Freeze data
011C: OBD Standards Compliance
0213: DTC O2 Sensors Present
0206: DTC Short Term Fuel Trim – Bank 1
0207: DTC Long Term Fuel Trim – Bank 1
0204: DTC Calculated Engine Load
0205: DTC Engine Coolant Temperature
0203: DTC Fuel System Status
0201: DTC Status since DTCs cleared
010E: Timing Advance
010D: Vehicle Speed
010F: Intake Air Temp
0208: DTC Short Term Fuel Trim – Bank 2
0209: DTC Long Term Fuel Trim – Bank 2
020F: DTC Intake Air Temp
020D: DTC Vehicle Speed
020E: DTC Timing Advance
0109: Long Term Fuel Trim – Bank 2
0108: Short Term Fuel Trim – Bank 2
0120: Supported PIDs [21-40]
0105: Engine Coolant Temperature
0104: Calculated Engine Load
0107: Long Term Fuel Trim – Bank 1
0106: Short Term Fuel Trim – Bank 1
0101: Status since DTCs cleared
0100: Supported PIDs [01-20]
0103: Fuel System Status
0214: DTC O2: Bank 1 – Sensor 1 Voltage
0220: DTC Supported PIDs [21-40]
ATRV: Voltage detected by OBD-II adapter
0211: DTC Throttle Position
0210: DTC Air Flow Rate (MAF)
0600: Supported MIDs [01-20]
0212: DTC Secondary Air Status
0215: DTC O2: Bank 1 – Sensor 2 Voltage
010C: Engine RPM
0219: DTC O2: Bank 2 – Sensor 2 Voltage
0218: DTC O2: Bank 2 – Sensor 1 Voltage
0240: DTC Supported PIDs [41-60]


